Analytics adoption
10%→38%
+28 percentage points
Recruiters struggled to identify hiring bottlenecks and decide what to improve. I took on product design, research and PM responsibilities, turning scattered data into clear, actionable insights across pipelines and the organization. In about a month and a half, I worked with T-Rex’s four developers, Customer Success, and customers to test and ship the web feature.
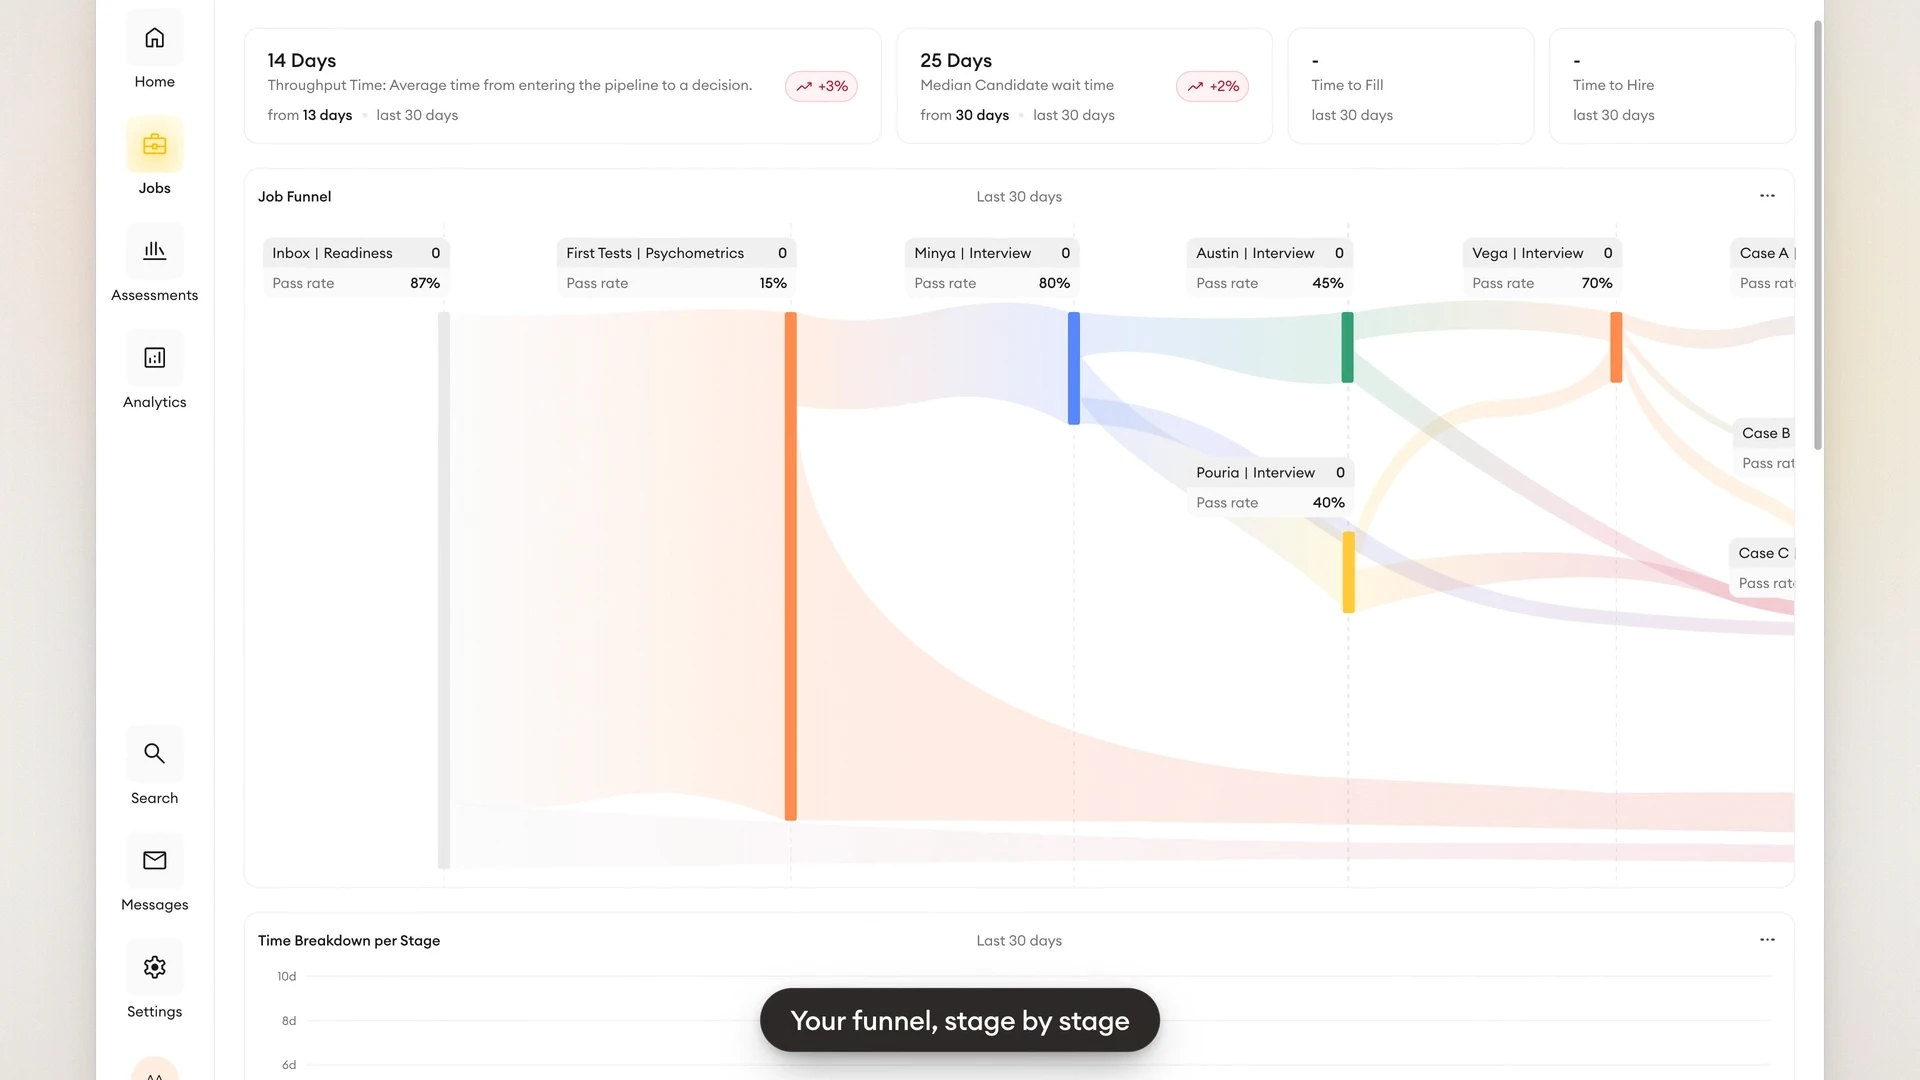
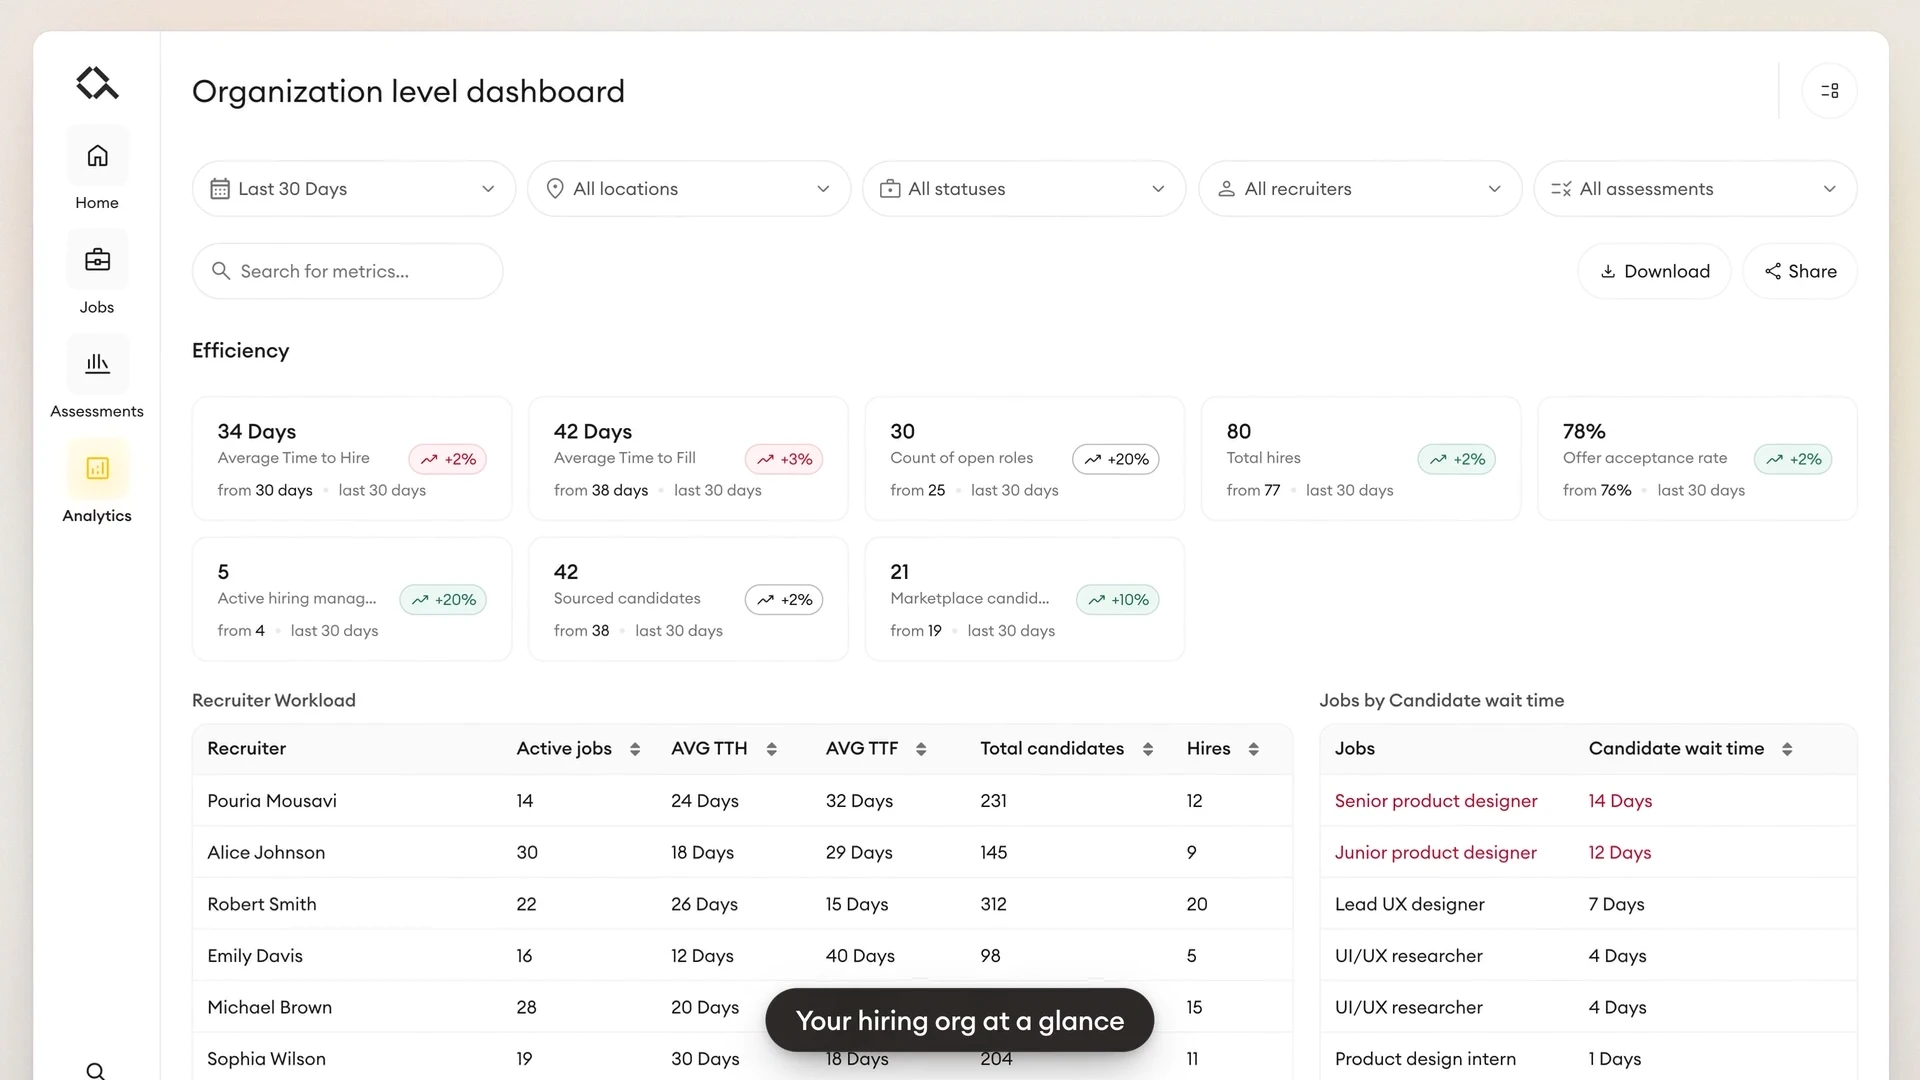
Interviews with recruiters and TA leaders
How teams evaluate hiring, use reports and decide what to change.
Shared hiring data
Across company sizes, industries and countries.
Recruiters and TA teams can't tell what's working in their hiring process, don't know what good looks like, and lack the evidence to drive improvements. If we help them hire faster, better, and prove their impact, they're less likely to churn and more likely to expand.
Reduce customer churn
Increase expansion within existing accounts
Increase the share of recruiting teams using evidence to improve their hiring process
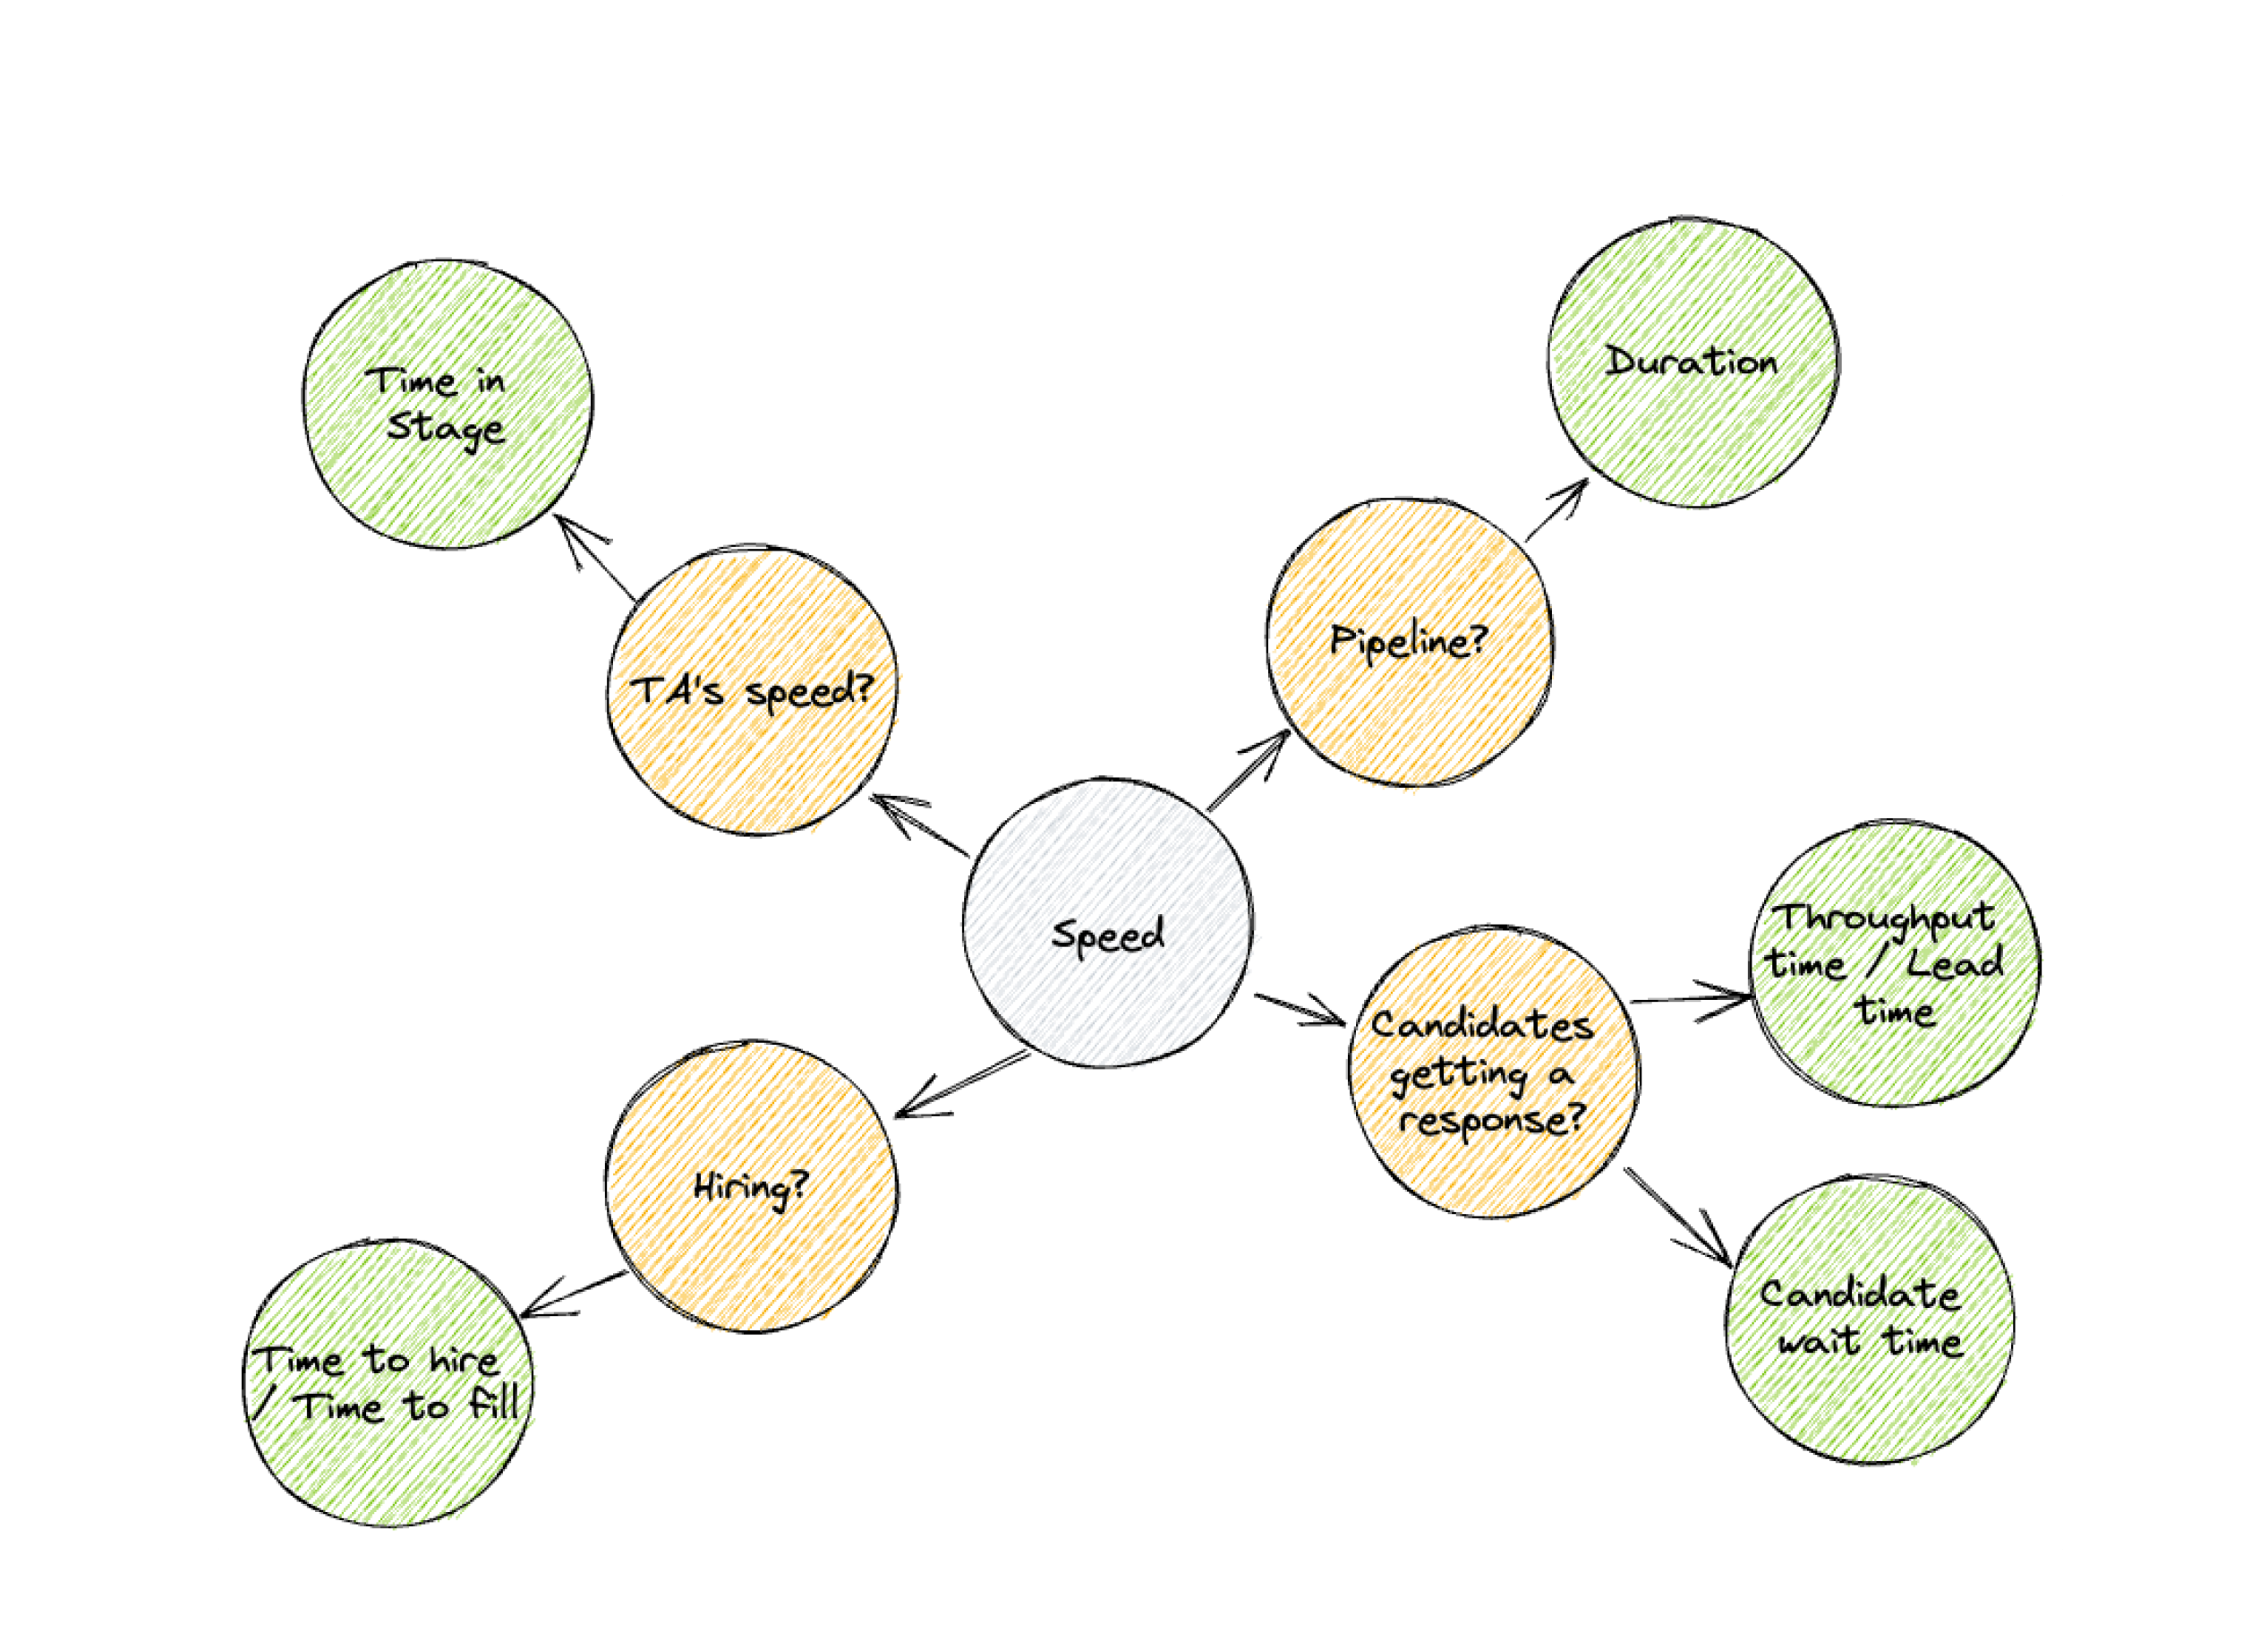
Retrospective refinement · not an originally measured resultTime to hire and time to fill showed how long hiring took. I broke down “speed” into measures that could show where time was being lost.
Recurring interview patterns
Missed time-to-hire targets
Four measures I defined for Alva
Familiar references retainedTime to hire · Time to fill
The MVP decision
Prioritize for MVP
Throughput timeDeferred
Hard to explain and implementTime candidates wait for the hiring team to act, score, or move them forward.
Total time each candidate spends in a hiring stage.
Time to complete each assessment, including scoring by the hiring team when needed.
Time to hire and fill, alongside each recruiter’s jobs, candidates, and hires.
The average time from entering the pipeline to a decision. We left it out of the MVP because it was too difficult to build and to explain to new users.
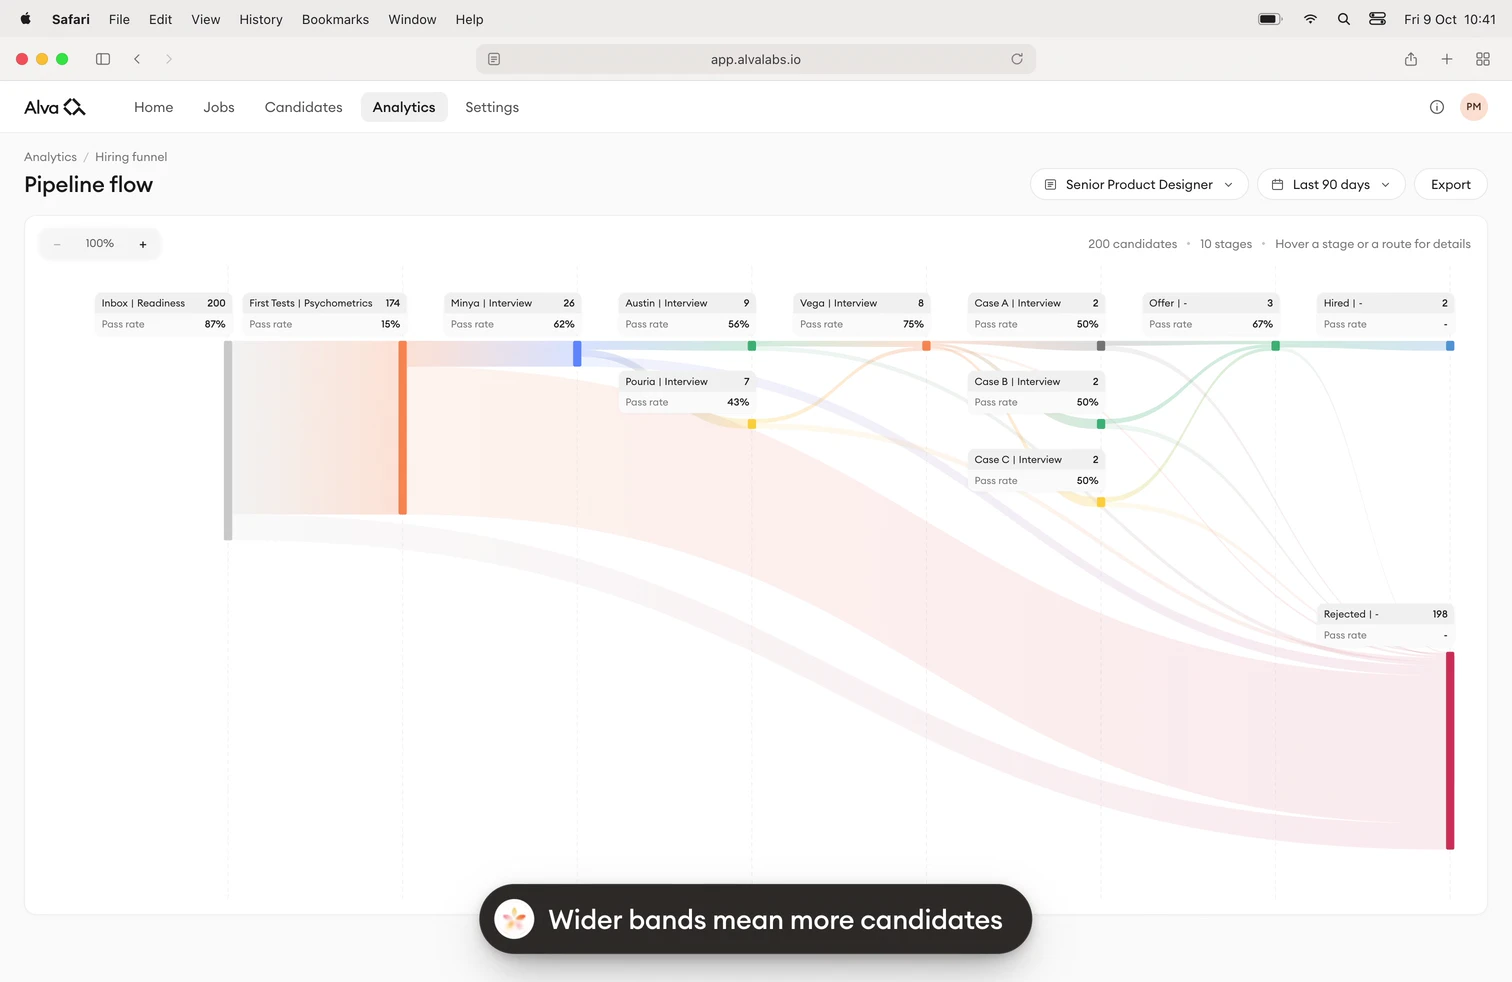
How candidates move through the pipeline, and where they drop off.
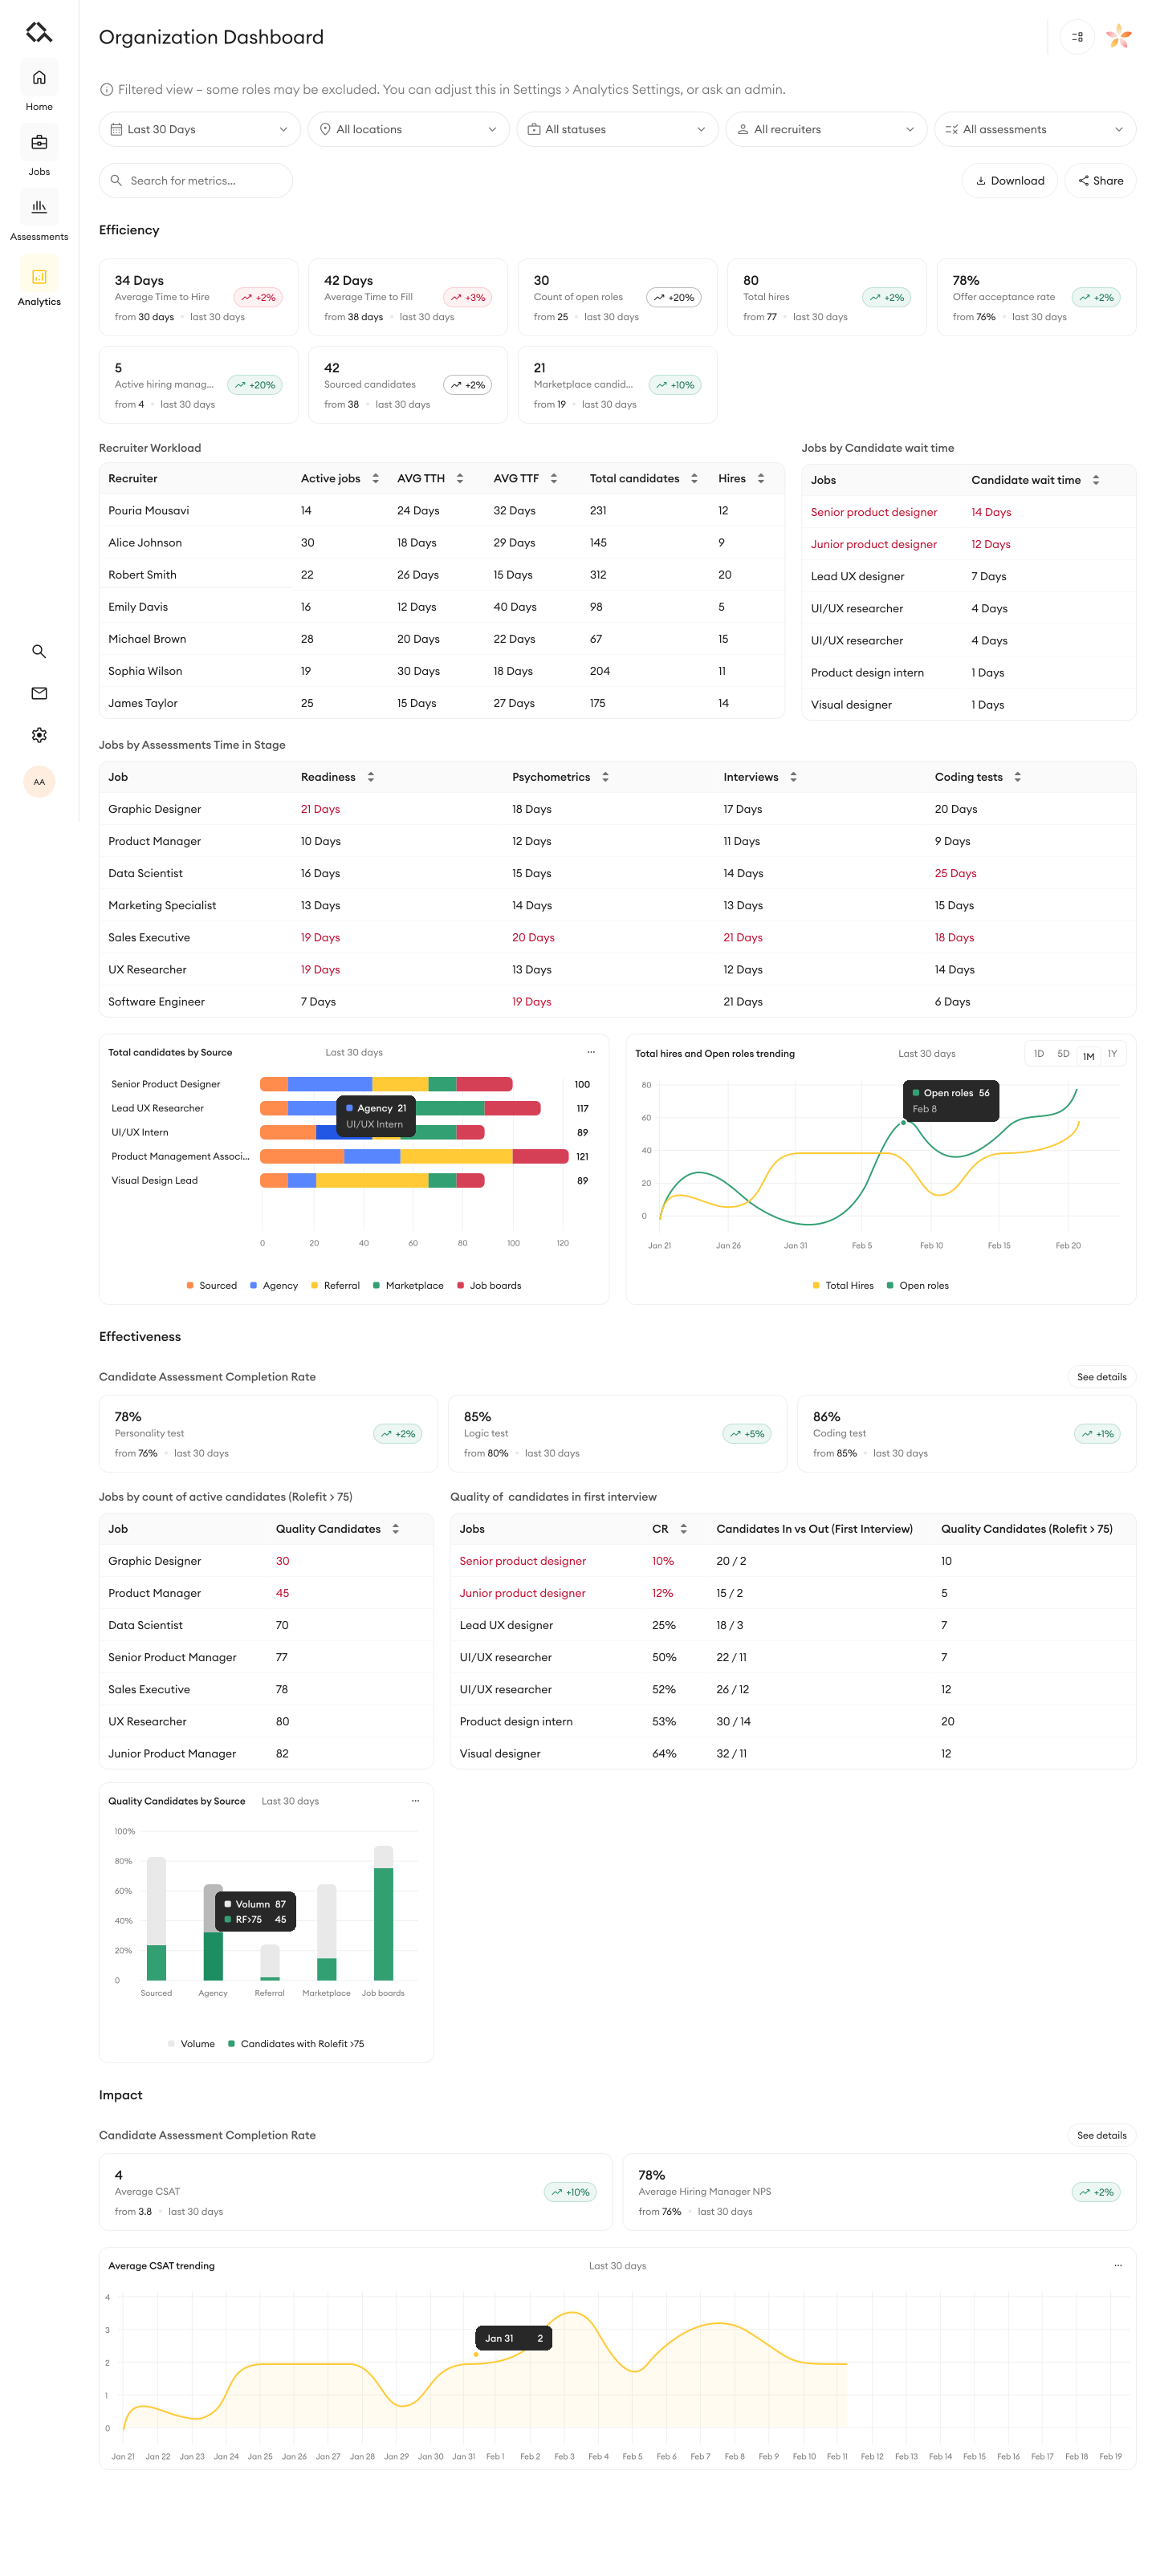
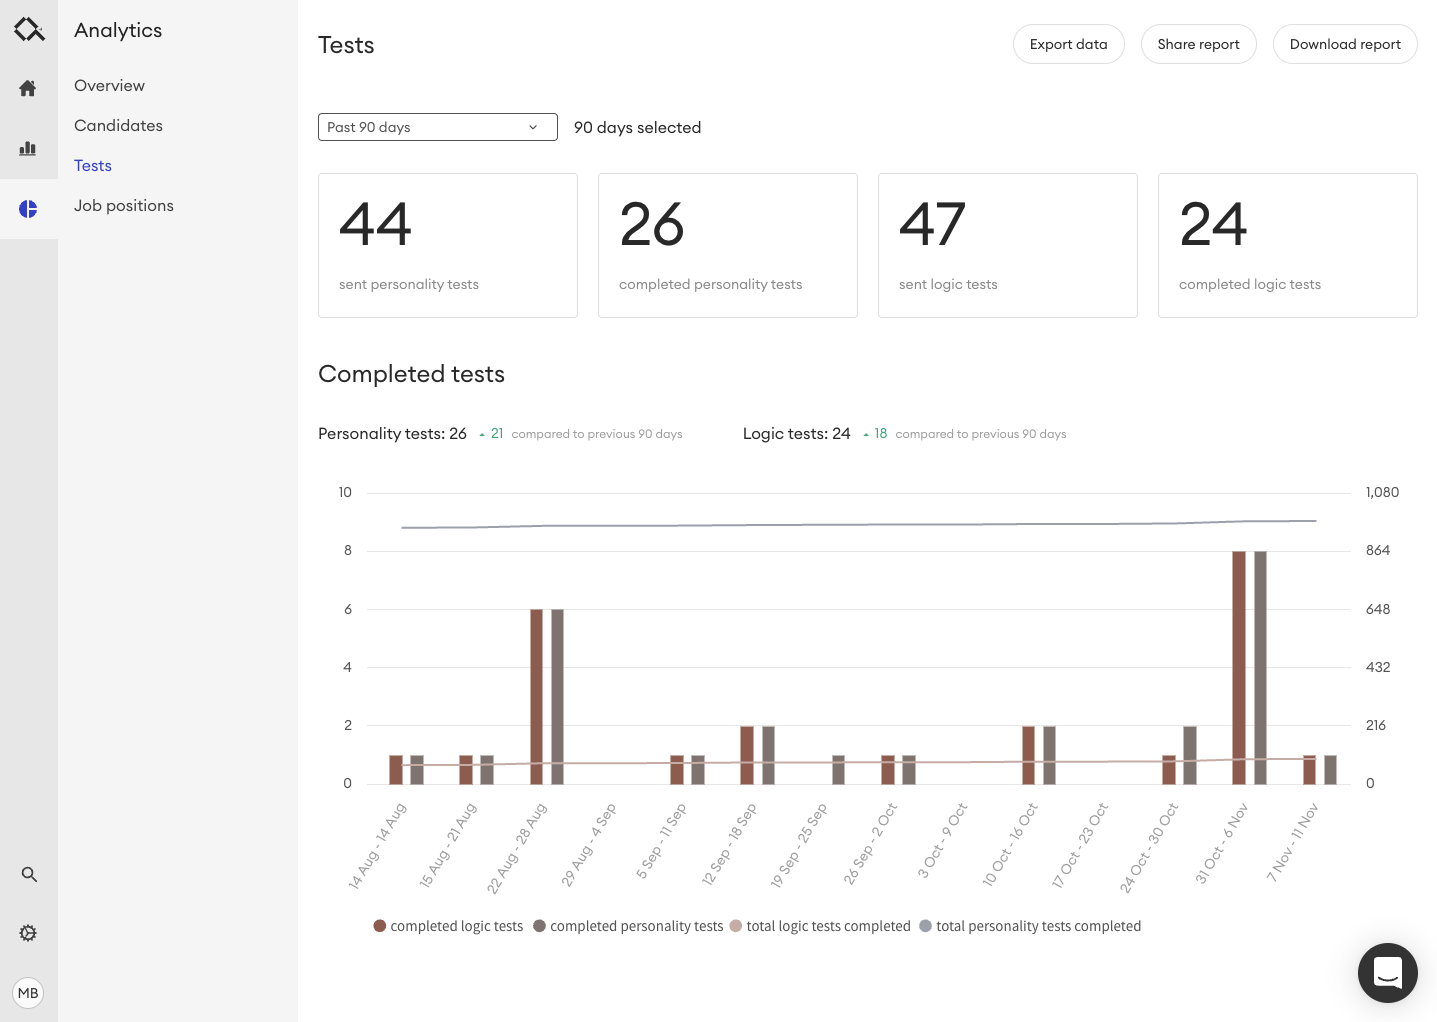
Drag the divider or use the arrow keys to compare.Scroll inside After to explore. Before stays fixed.
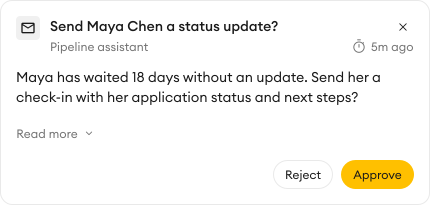
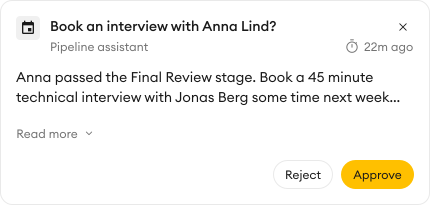
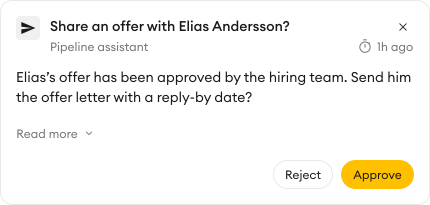
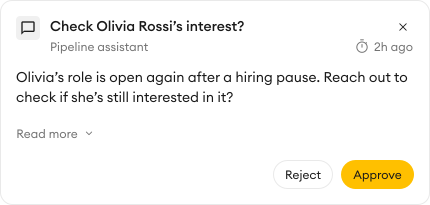
Recruiters already had plenty of admin. I wanted delays to surface with a clear next step, without making them search Analytics.
Recurring interview themes
Issues stayed hidden until someone looked.
A card recruiters could act on
Each card described the issue and suggested a response, like a status update, for the recruiter to approve.
I explored different card types. Describing the issue and suggesting a response gave recruiters more help than a warning alone.
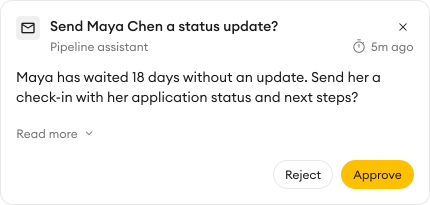
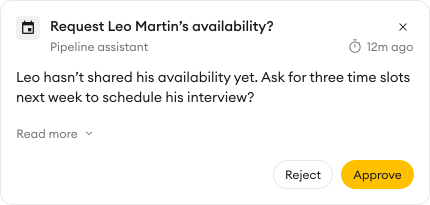
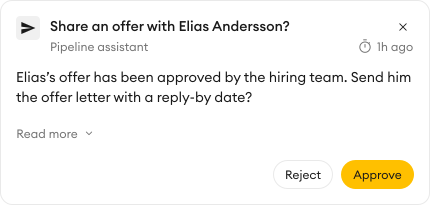
The homepage brought issues and suggested next steps into recruiters’ daily work, so they didn’t have to remember who was waiting.
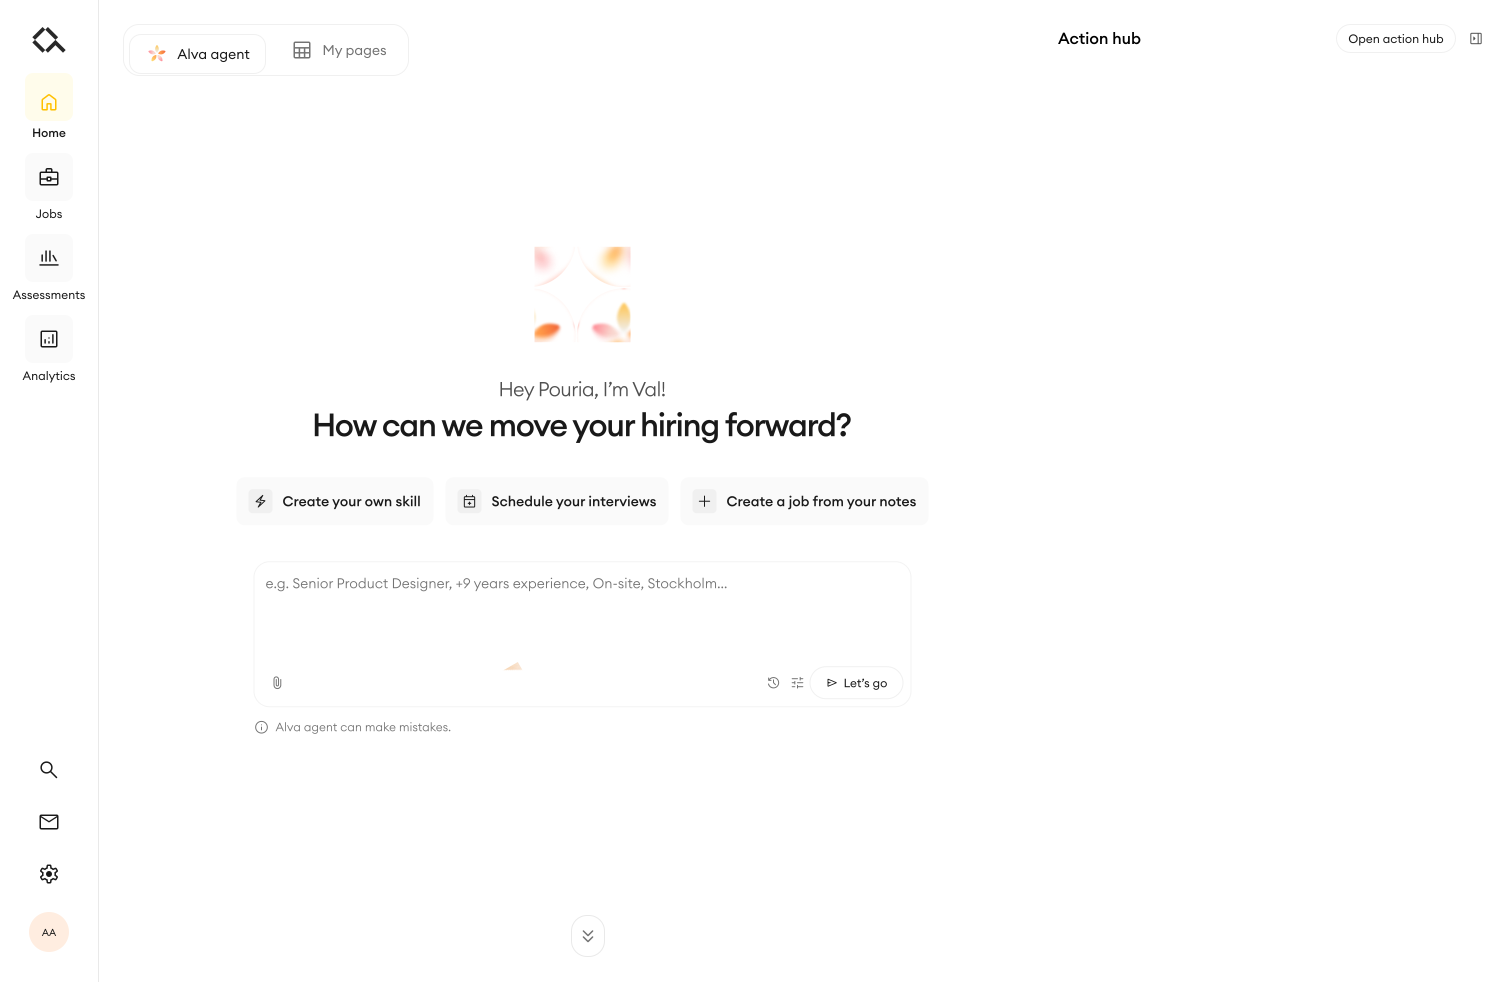
See what needs attention. Issues and suggested next steps, without digging through the data.
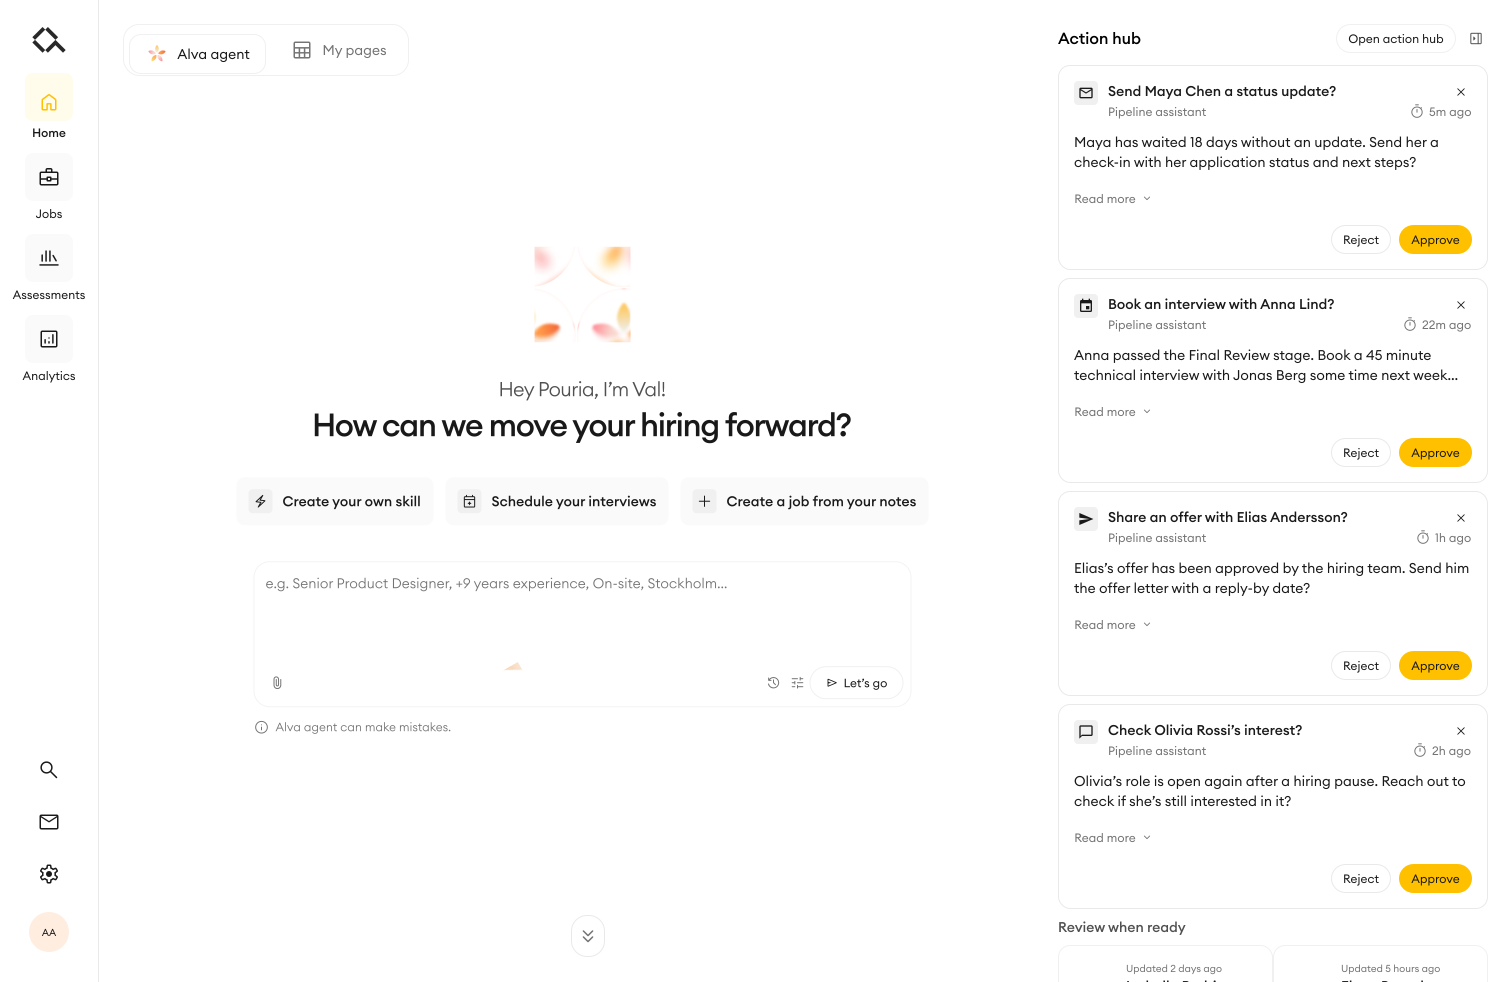
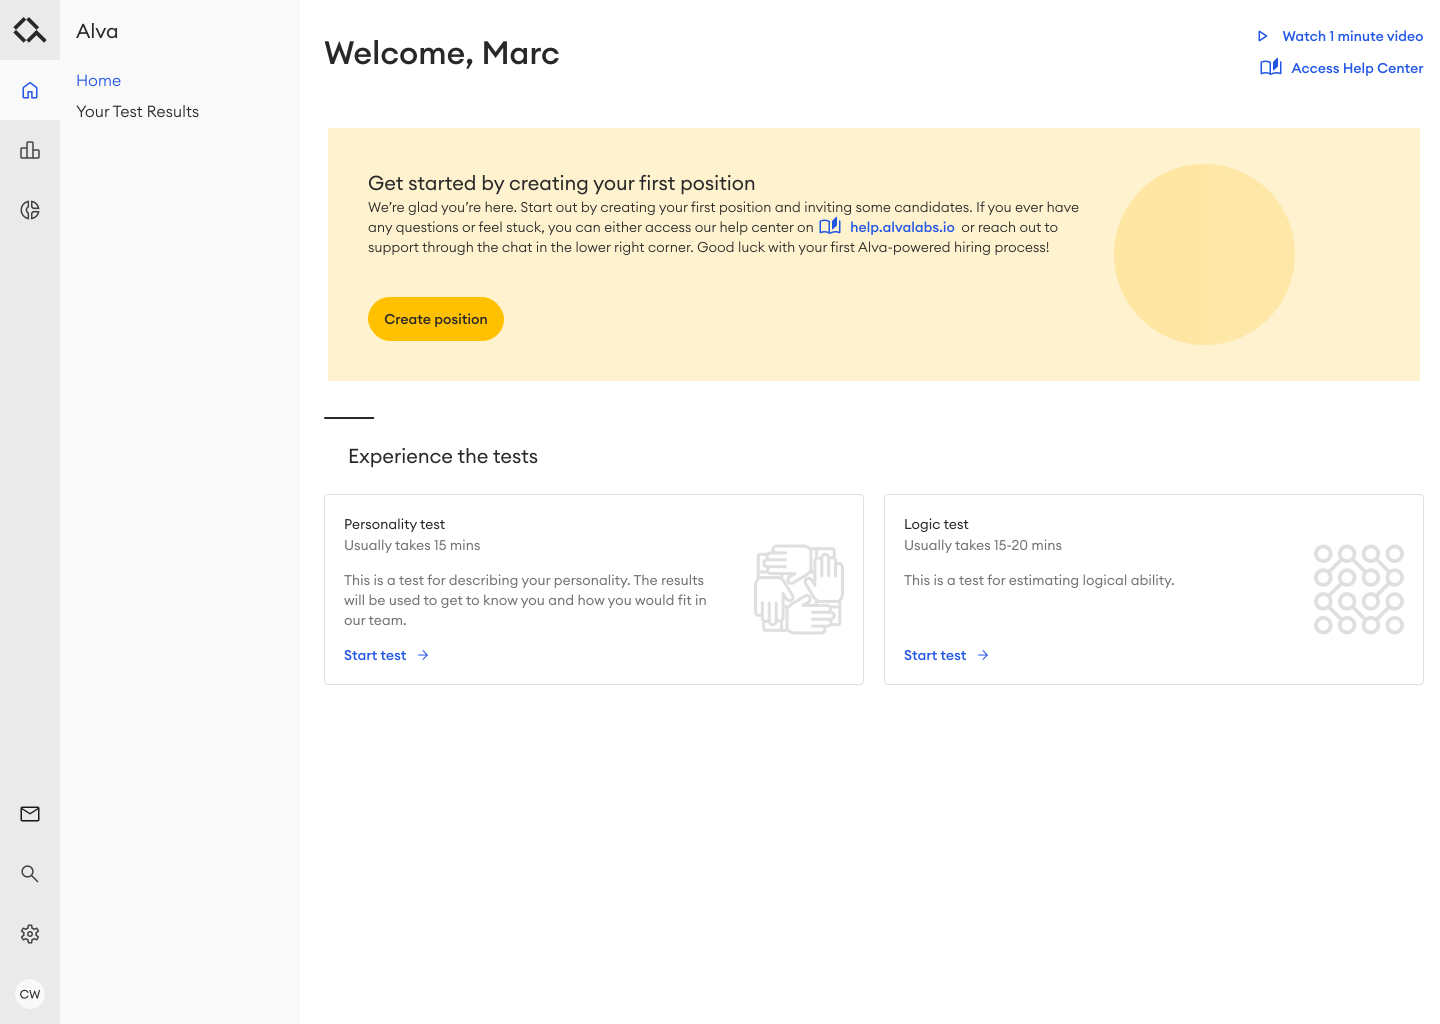
Drag the divider or use the arrow keys to compare.
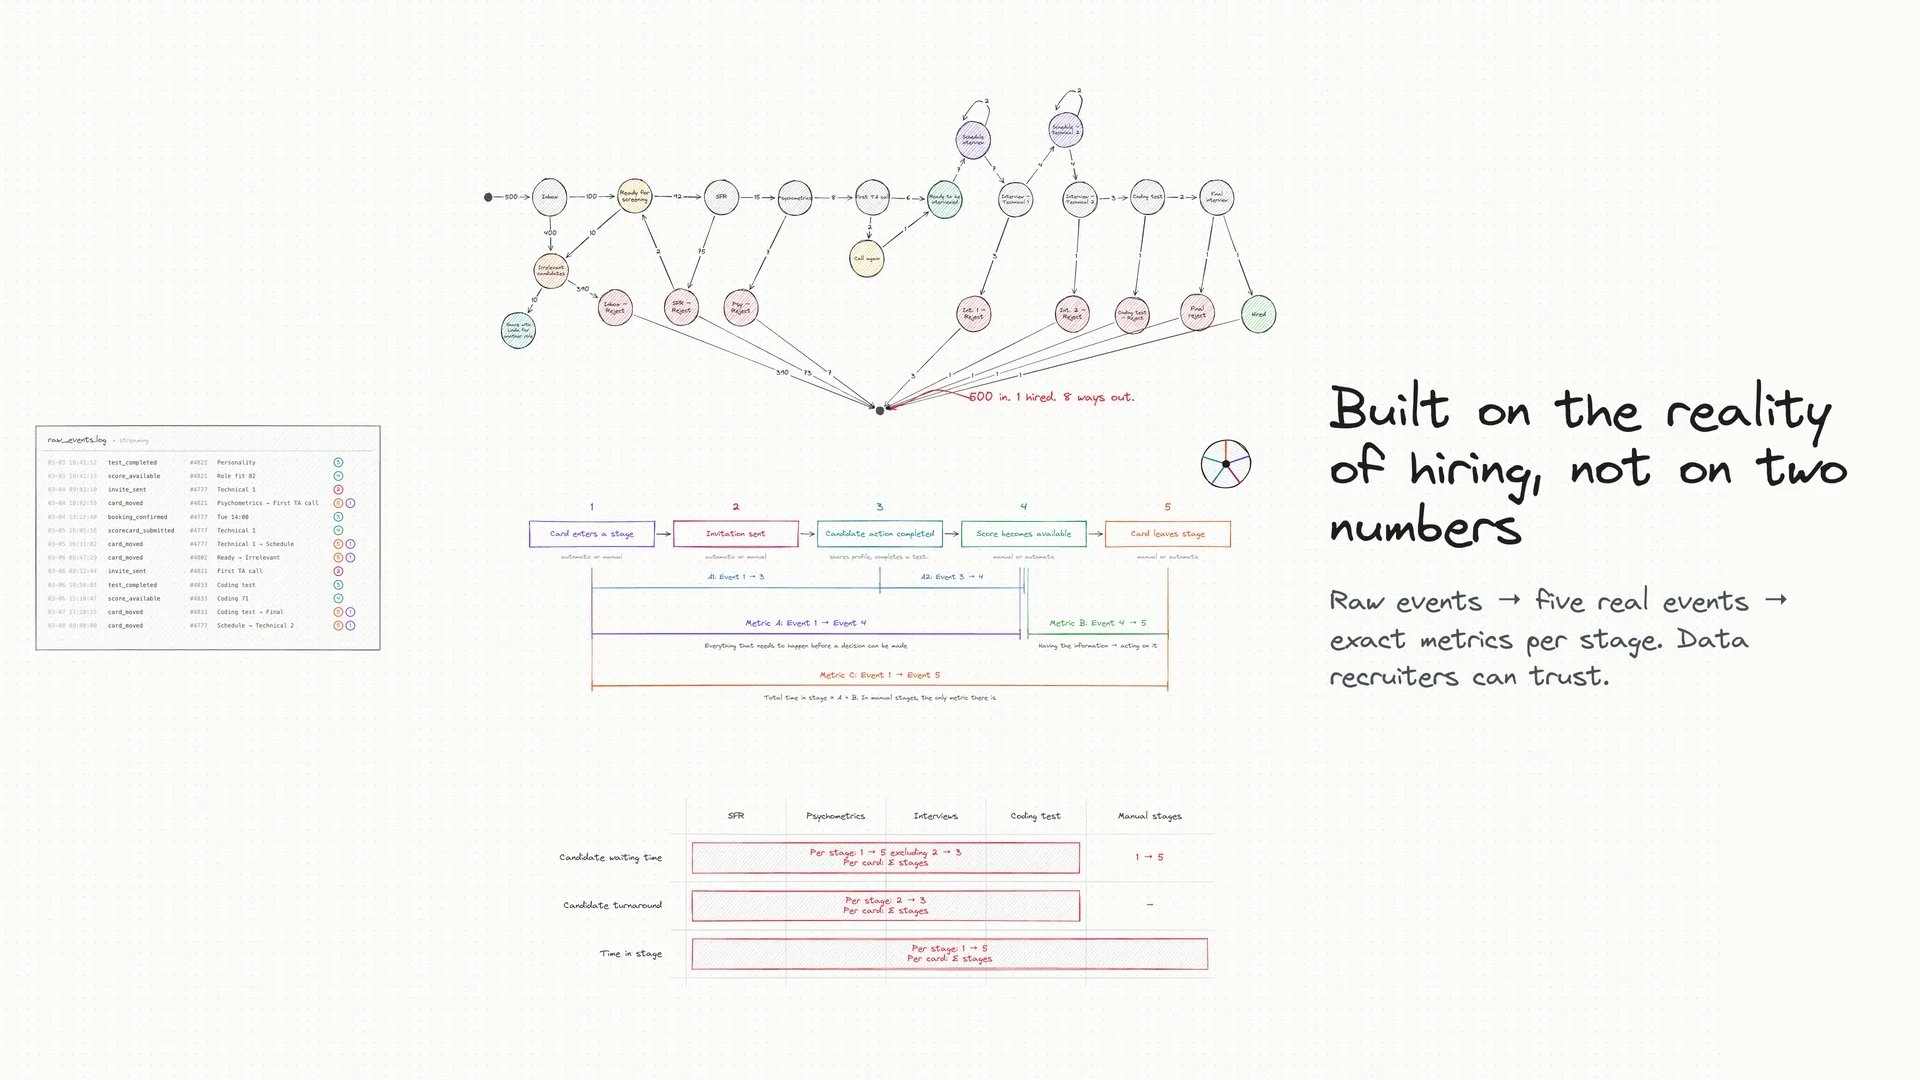
Time to hire and time to fill mattered to recruiters, but they didn’t tell the whole story.
I went back to the raw data and redefined the metrics around how candidates actually moved. That meant treating the pipeline as a graph, with steps people could skip or return to, rather than a straight line from application to hire.
10%→38%
+28 percentage points
2large contracts
won
Better Analytics helped us win these deals against a competitor.
All three improved for customers who opted into the new Analytics. Results varied by industry, company size and role.
Fewer calls.
Fewer analytics issues.
Customer Success reported a substantial drop in analytics-related calls and problems.
Qualitative feedback
Design, research
and product management.
When our PM left at the start, I took on all three roles for 3–4 months. I drove the project, working closely with my squad.
I worked with developers almost daily to check event tracking and clarify requirements, using maps, recorded walkthroughs and detailed discussions to explain the changes.