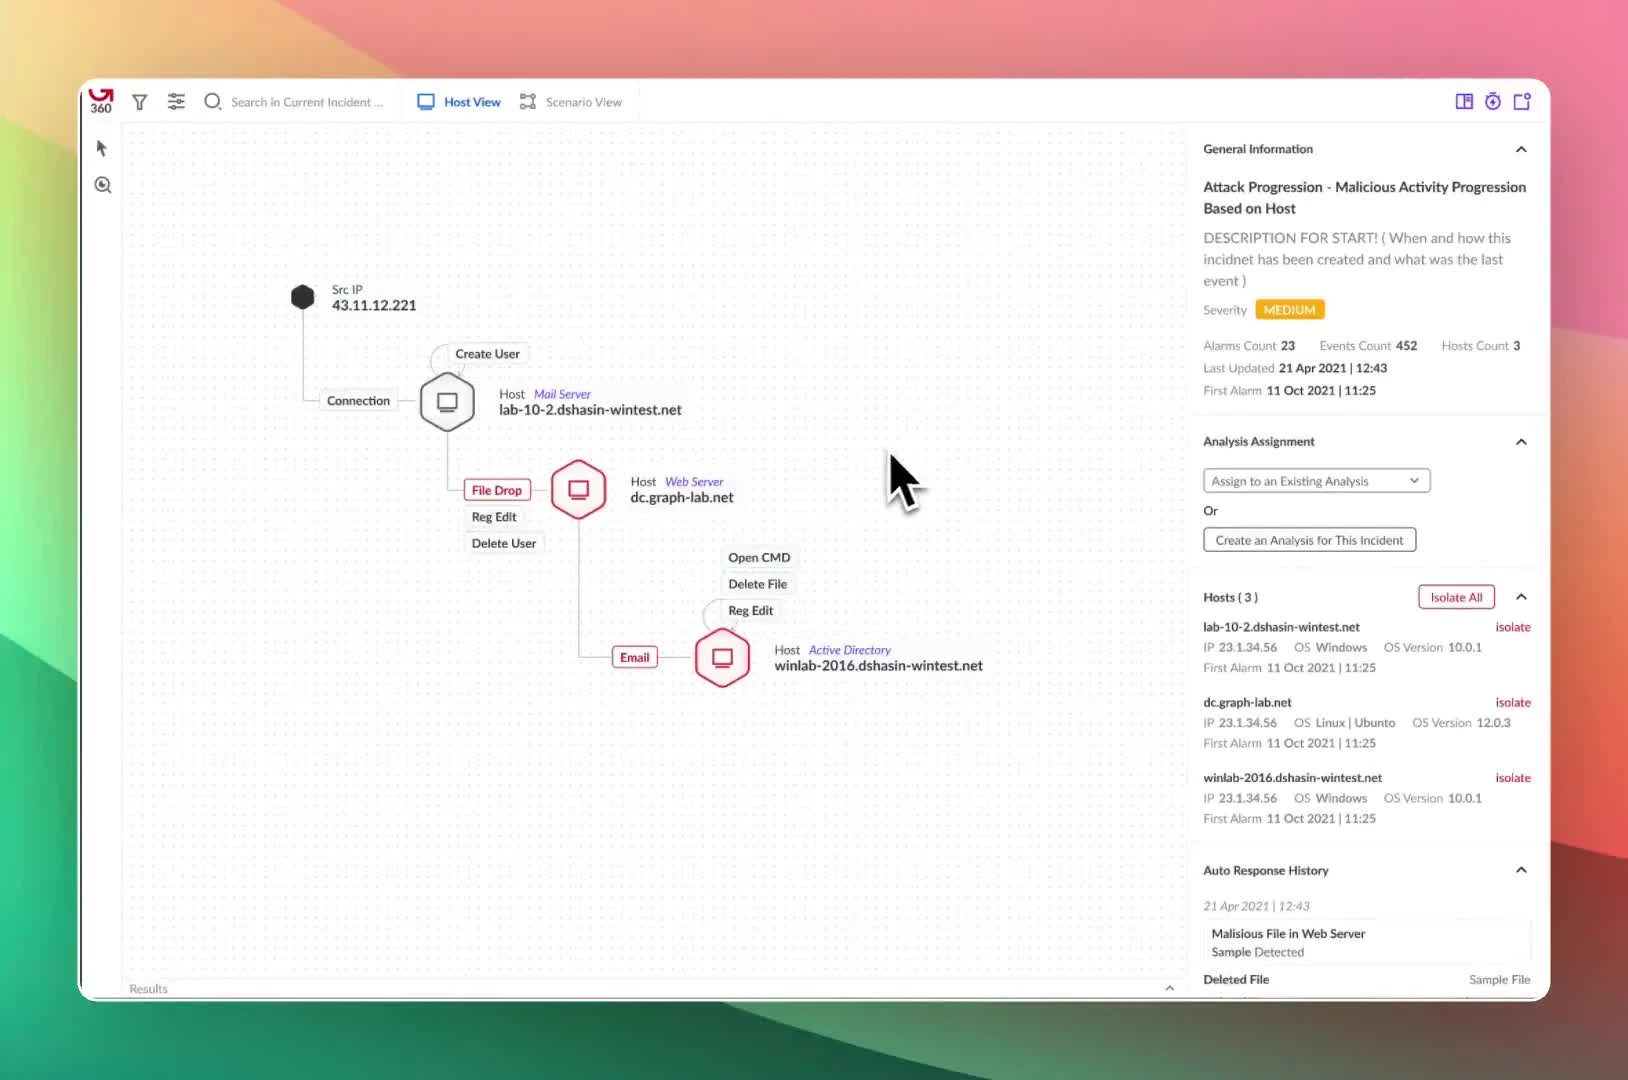
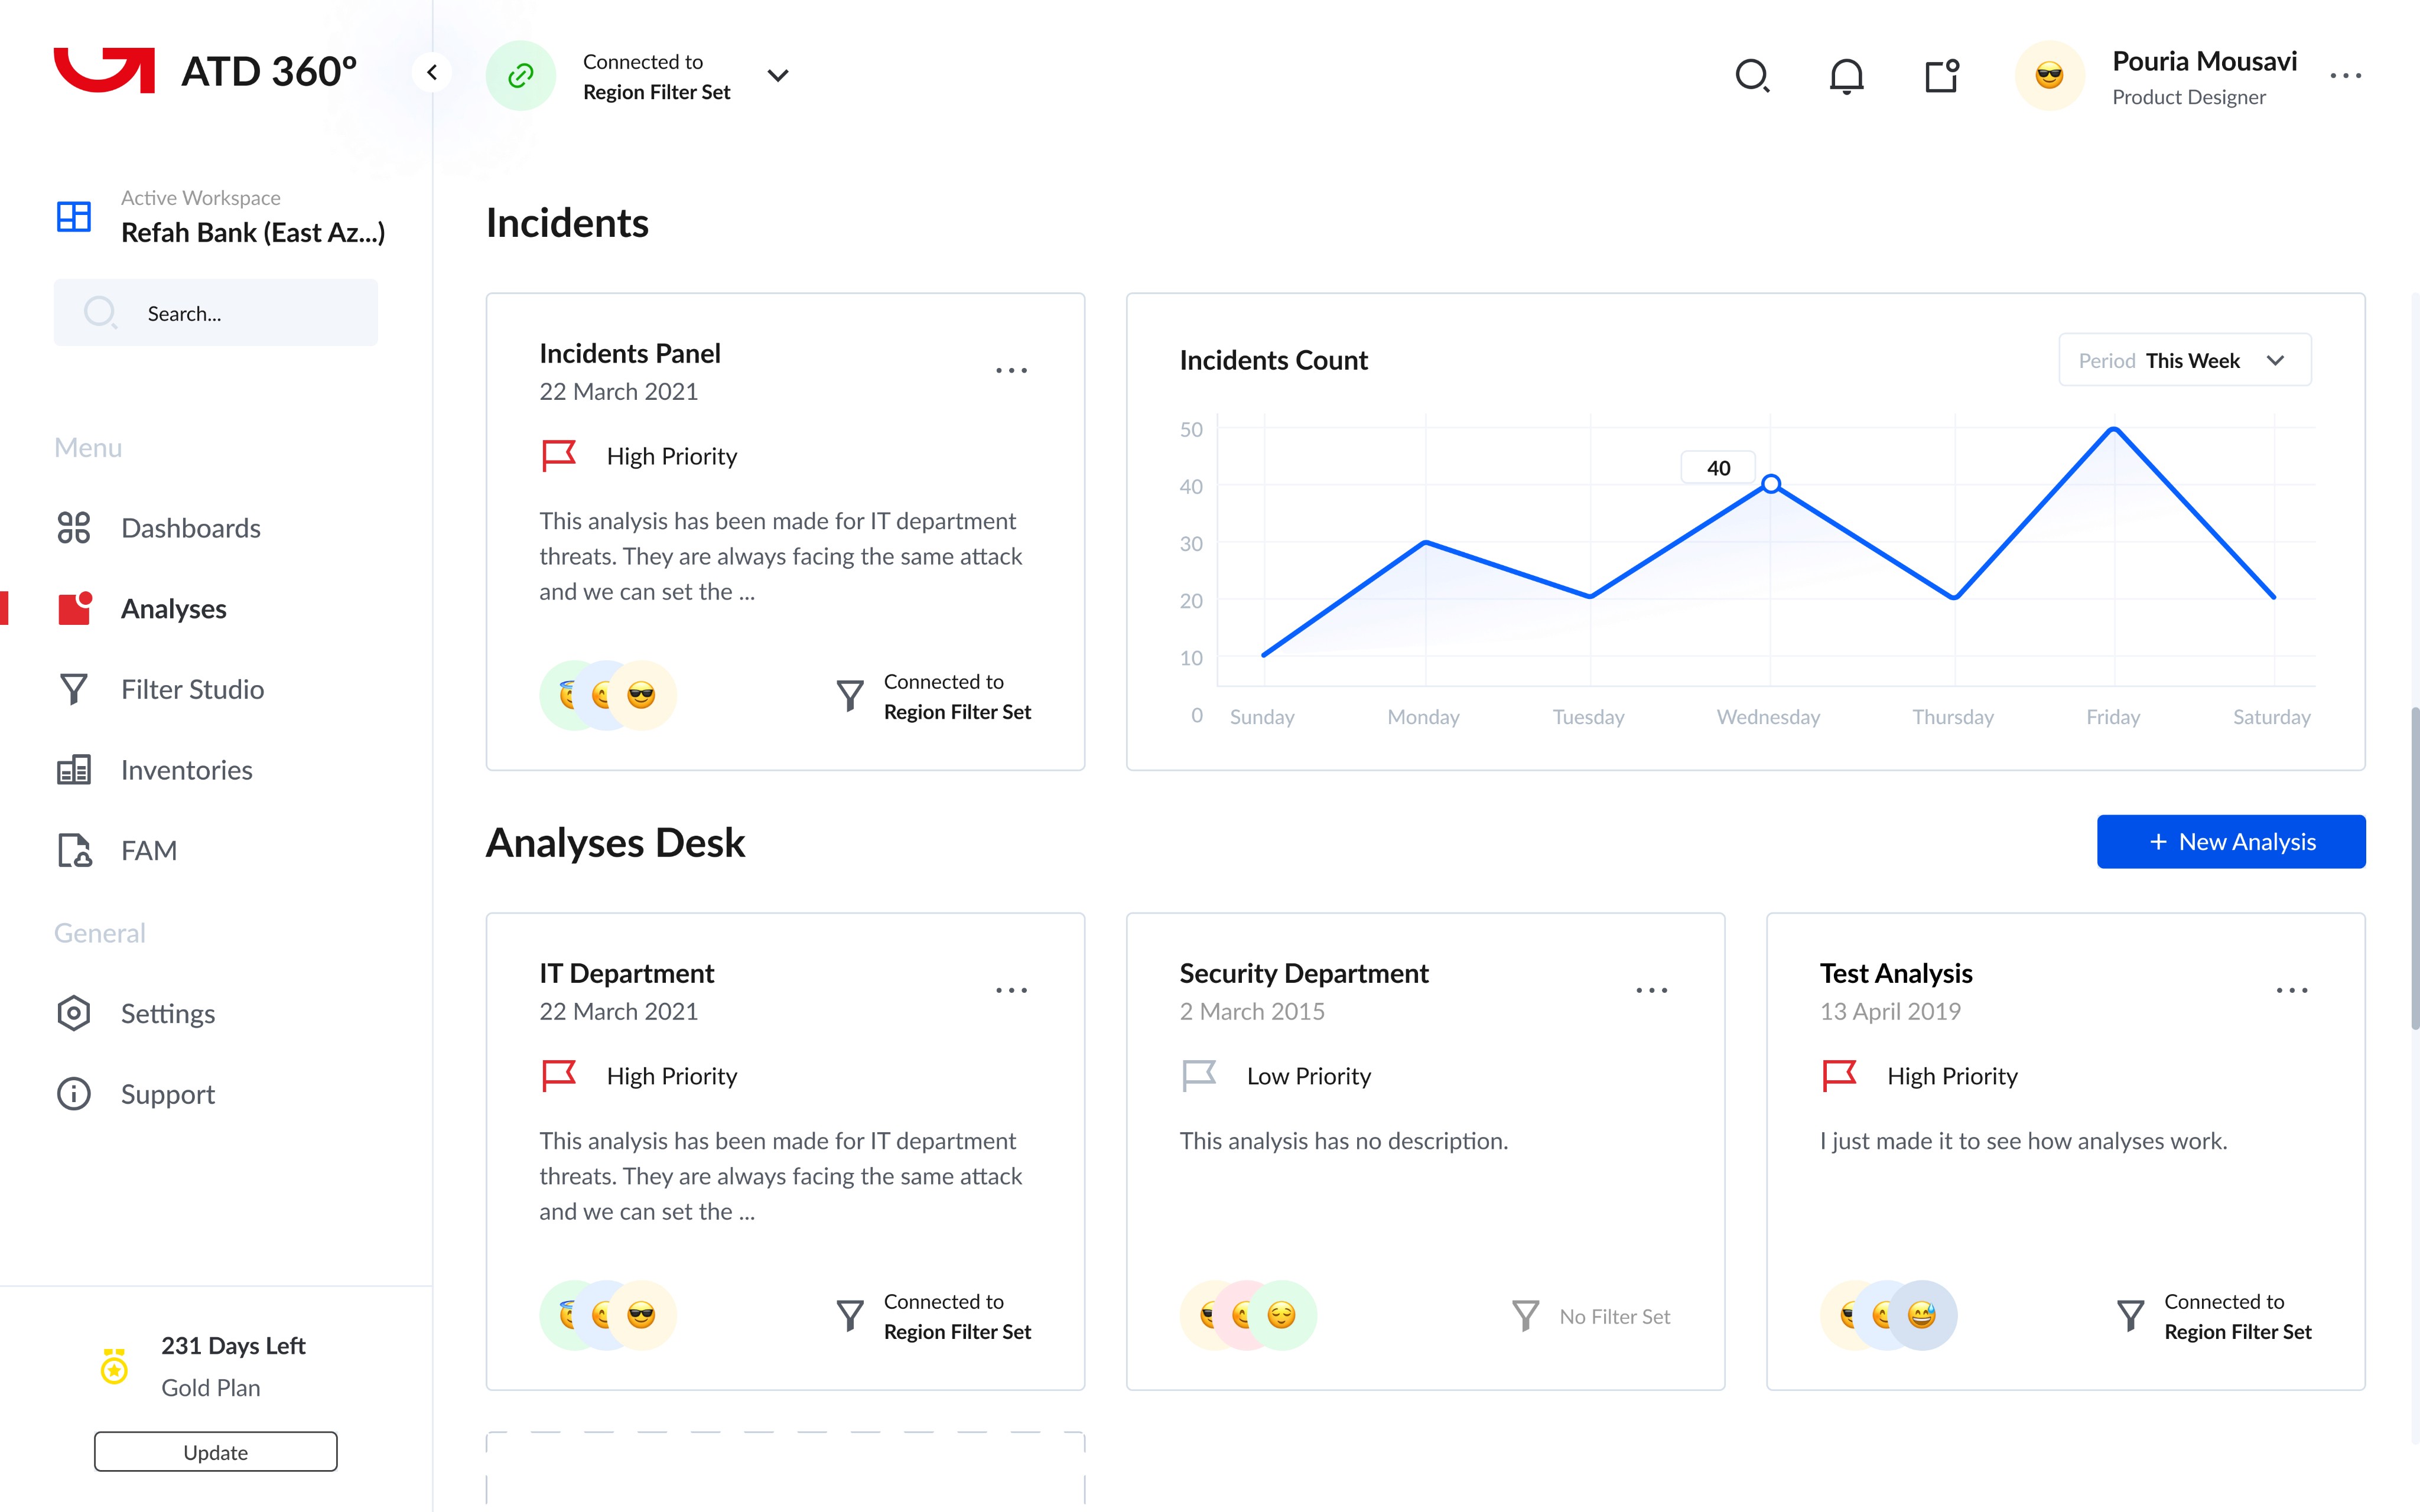
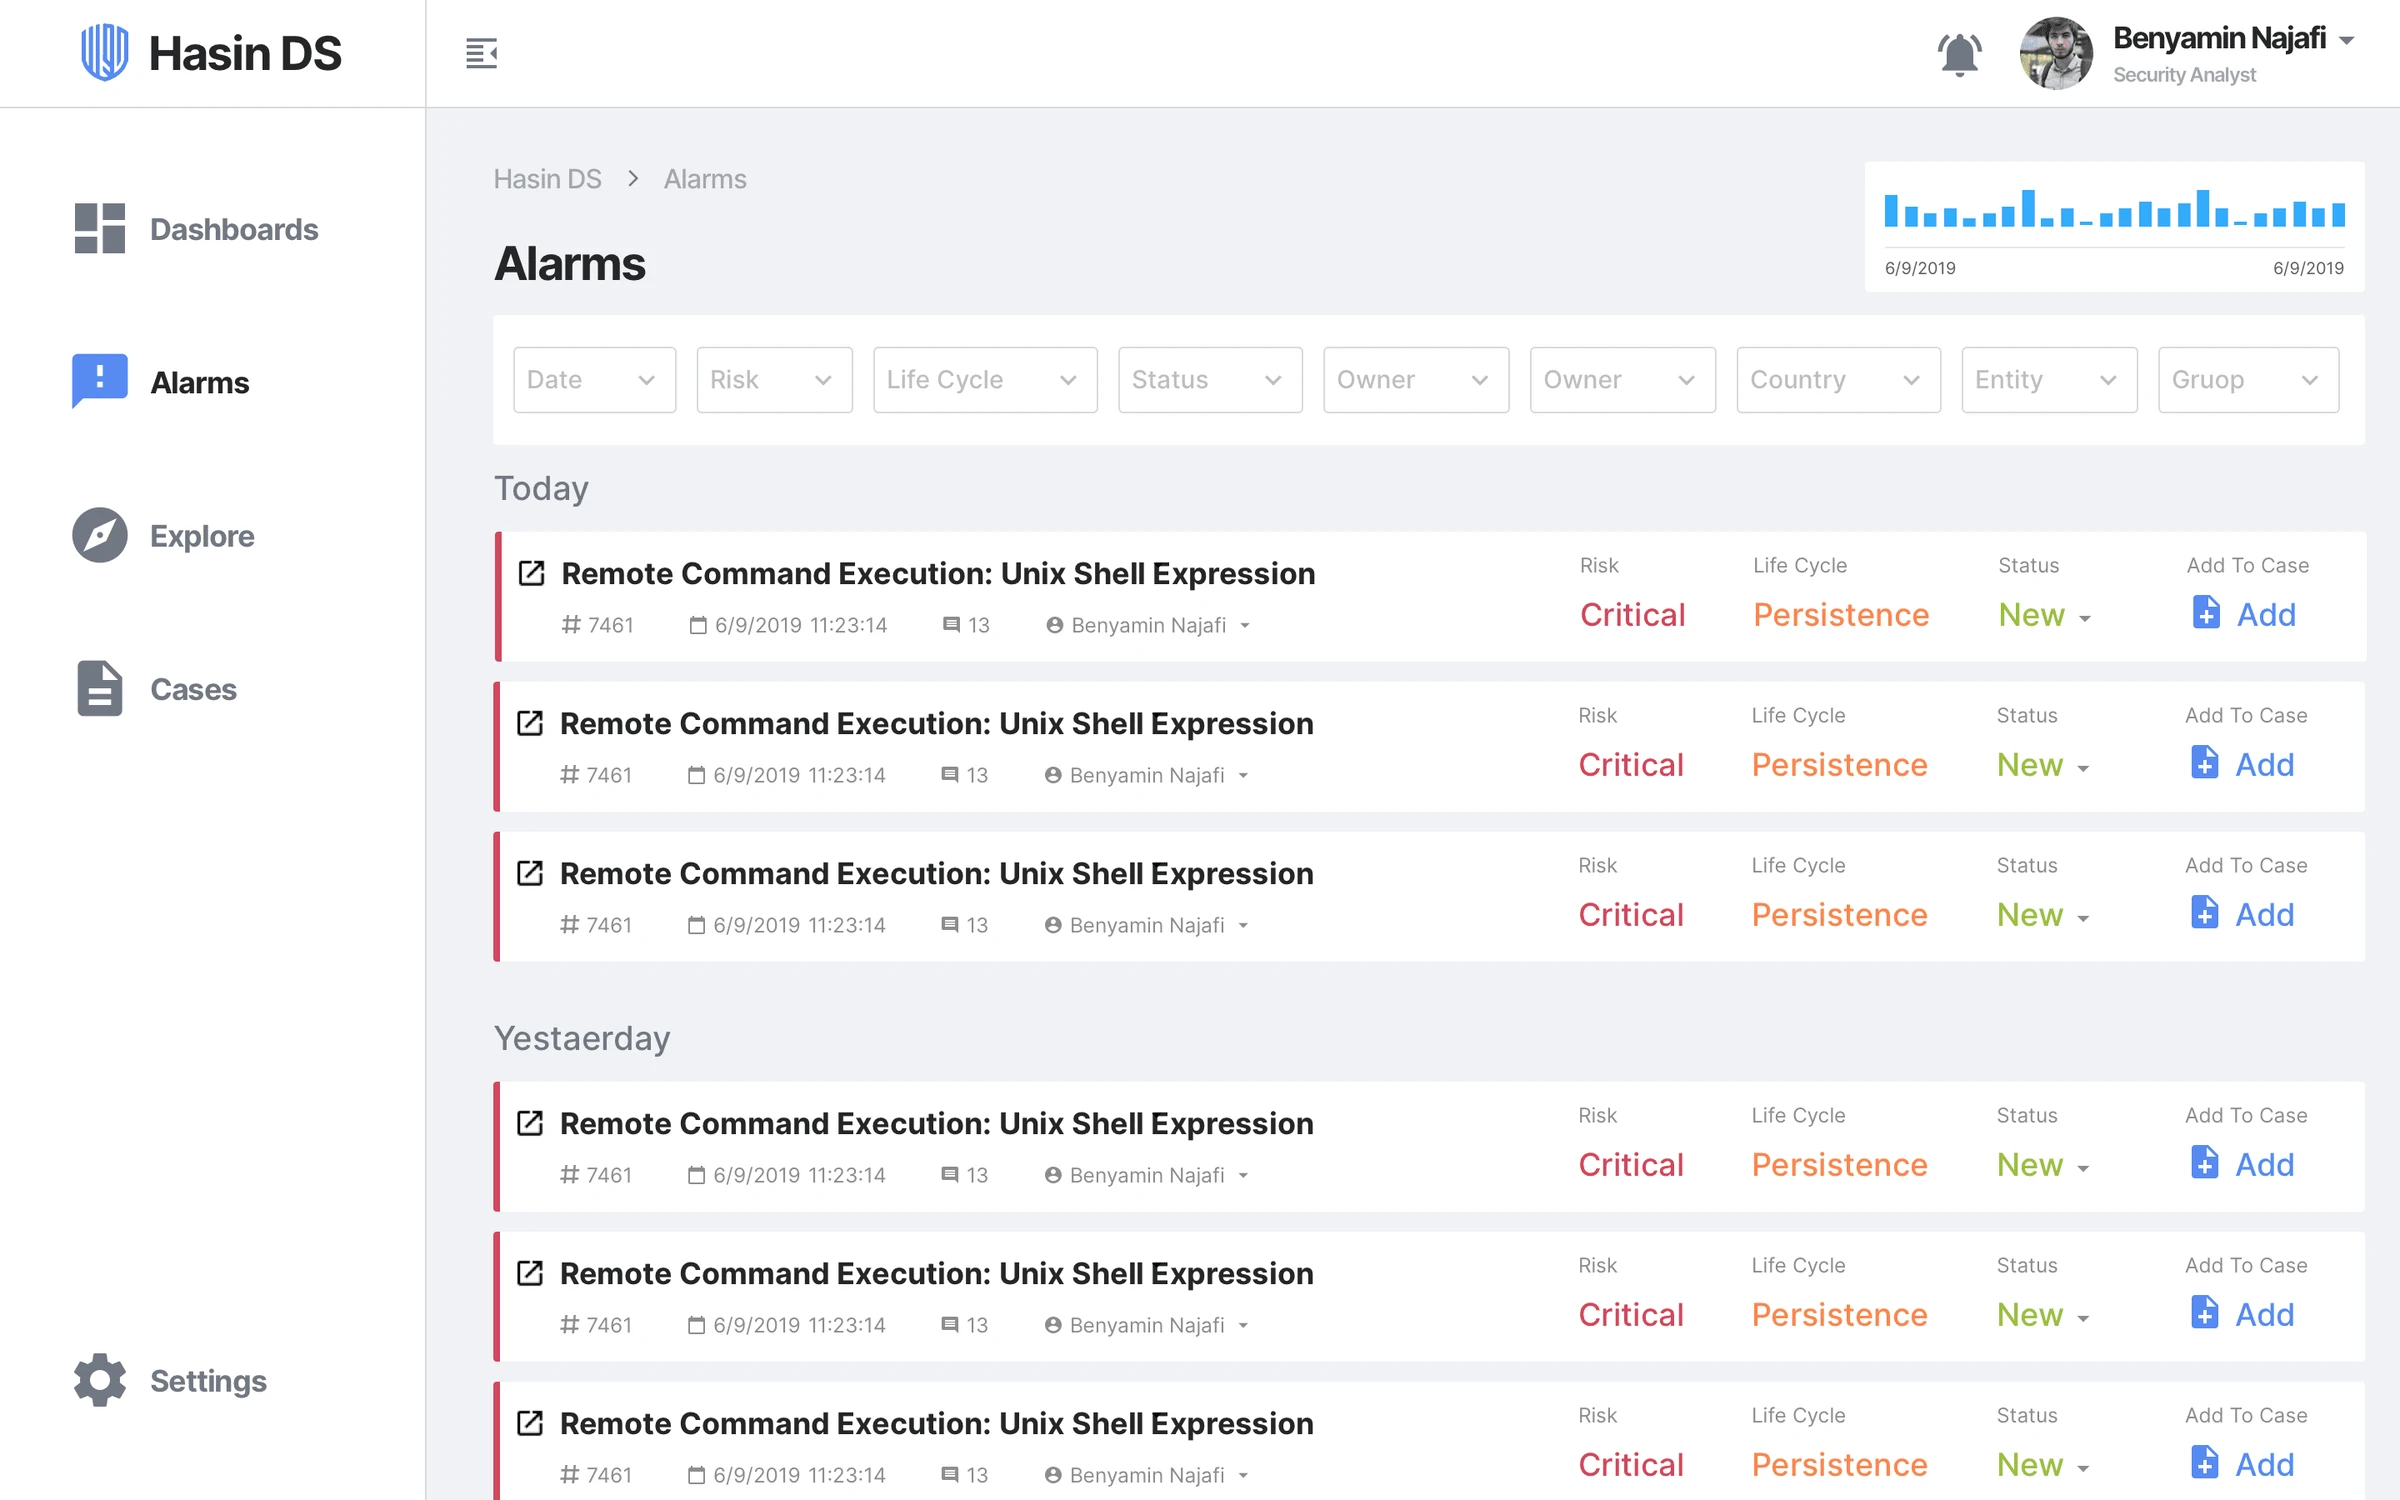
Security analysts were opening alarm after alarm, keeping details in notes or memory, then switching to a terminal to respond. I researched and designed Graph Flow in ATD 360 to connect related alarms in one view and put the information and actions analysts needed within reach.
The original ATD 360 walkthrough: investigating an incident and opening its related profiles.
02 · Why it mattered
Analysts couldn’t keep up. Customers were leaving.
25%Did not renew their license
Stakeholder interviews showed that a quarter of customers had not renewed within three months. Customers found the product difficult to use, and when an experienced analyst left, the people taking over struggled.
ATD tracked events across an organization’s endpoints. When events matched a known threat pattern, it generated an alarm with a severity level. Security analysts then had to decide whether the alarms formed an attack scenario and how to respond.
01 · EventsA pattern is detected
Connections, logins, uploaded files, newly created users, and file deletions are tracked across endpoints.
02 · AlarmsAn analyst investigates
Known patterns trigger alarms. Analysts review them daily and look for threats.
03 · ResponseTake the appropriate action
Validate the scenario and respond on the affected systems.
My role at Graph↗
I worked across Graph’s products over three years. My role developed from interaction design and user research to product design, research, and design systems, then product design leadership and research. This case focuses on Graph Flow within ATD, the company’s flagship product.
01 · Stakeholder interviews
Define the business signal
I asked what losing a customer actually meant: removing the software, ending a contract, or deciding not to renew a license.
02 · Six participants, 12 scenarios
Watch the work
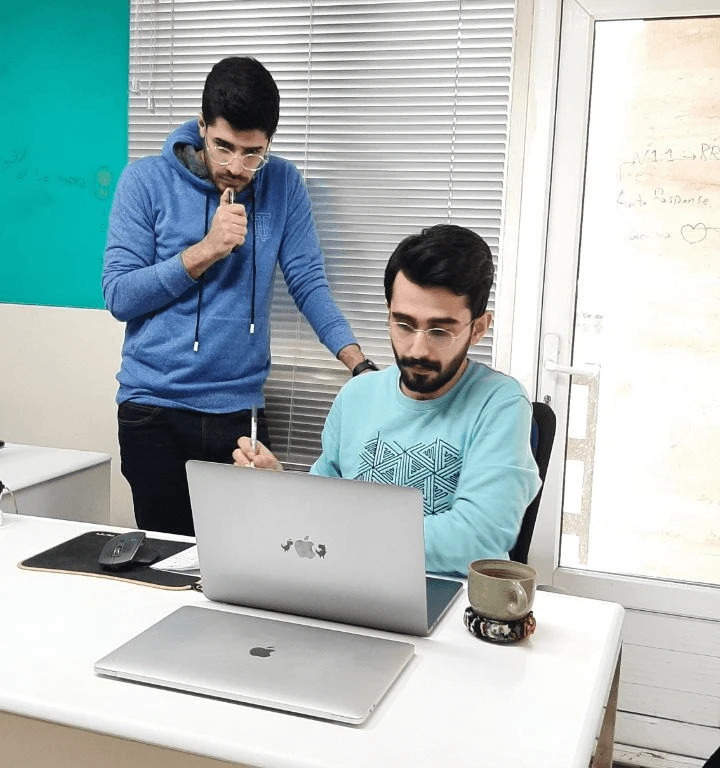
I was new to cybersecurity. I began by observing analysts investigating attack scenarios, so I could understand the work before proposing changes.
03 · Eight interviews
Understand the difficulties
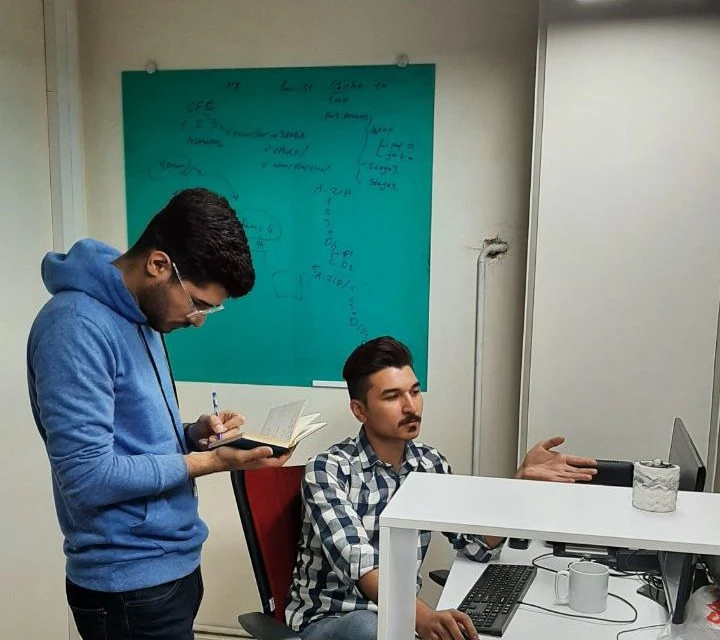
Once I understood the workflow, I interviewed analysts about the problems at each step.
The research questions and sessions↗
How were security analysts working?
What did “difficult” mean, and how could I measure it?
Who were our users?
At what scale were we losing customers?
What made the product difficult to use?
Understanding the existing work.Investigating the difficulties behind the workflow.
The same five steps, hundreds of alarms
01
Check the alarm list for a pattern.
02
Open several alarms in separate tabs to explore the details.
03
Switch between tabs, memorizing details or taking notes.
04
Potentially identify an attack pattern.
05
Connect to the affected systems through a Linux terminal and execute response scripts.
“It's so hard to memorize and keep the data in your mind while switching between different tabs.”
“Bad days occur when a real attack happens. We are buried under thousands of alarms and can’t react quickly”
All interview notes↗
It's so hard to memorize and keep the data in your mind while switching between different tabs.
I can't react fast even when I find the threat. there was a time I found a hacking connection and it took 2 mins to close it.
Finding patterns between hundreds of alarms every day and I can't hit my daily goal with all of these alarms
It happens a lot during the day that I miss a specific alarm and I get the whole pattern wrong.
I can't detect a long planned attack. I have to check even previous alarms in the month to find if this new alarm is related to that one.
I get confused easily with all these tabs open. I just separate them in different windows.
It's so hard to find the pattern in one look. Even I with several years of experinece get confused with so many alarms
Bad days occur when a real attack happens. We are buried under thousands of alarms and can’t react quickly
I know what I need to accomplish, but I always have to complete numerous small tasks to get my job done
Try checking a malicious file yourself using the software, and you’ll understand what I mean by ‘pain’.
I’ve attempted to use numerous scripts, which I wrote myself, to automatically identify patterns that are familiar to me.
The difficulties went beyond reading an alarm: analysts struggled to meet their daily target for detected attack scenarios, find patterns, respond quickly, divide work across the team, handle the alarm volume, and switch between products.
Two problems to focus on
Validating one threat required information spread across several tabs.
Responding then required manual scripting across other applications.
Both got in the way of analysts reaching their daily detection target.
03 · Design decisions
Connect the evidence. Make it possible to act.
Problem 1I have hundreds of alarms, but I can’t see how they connect.
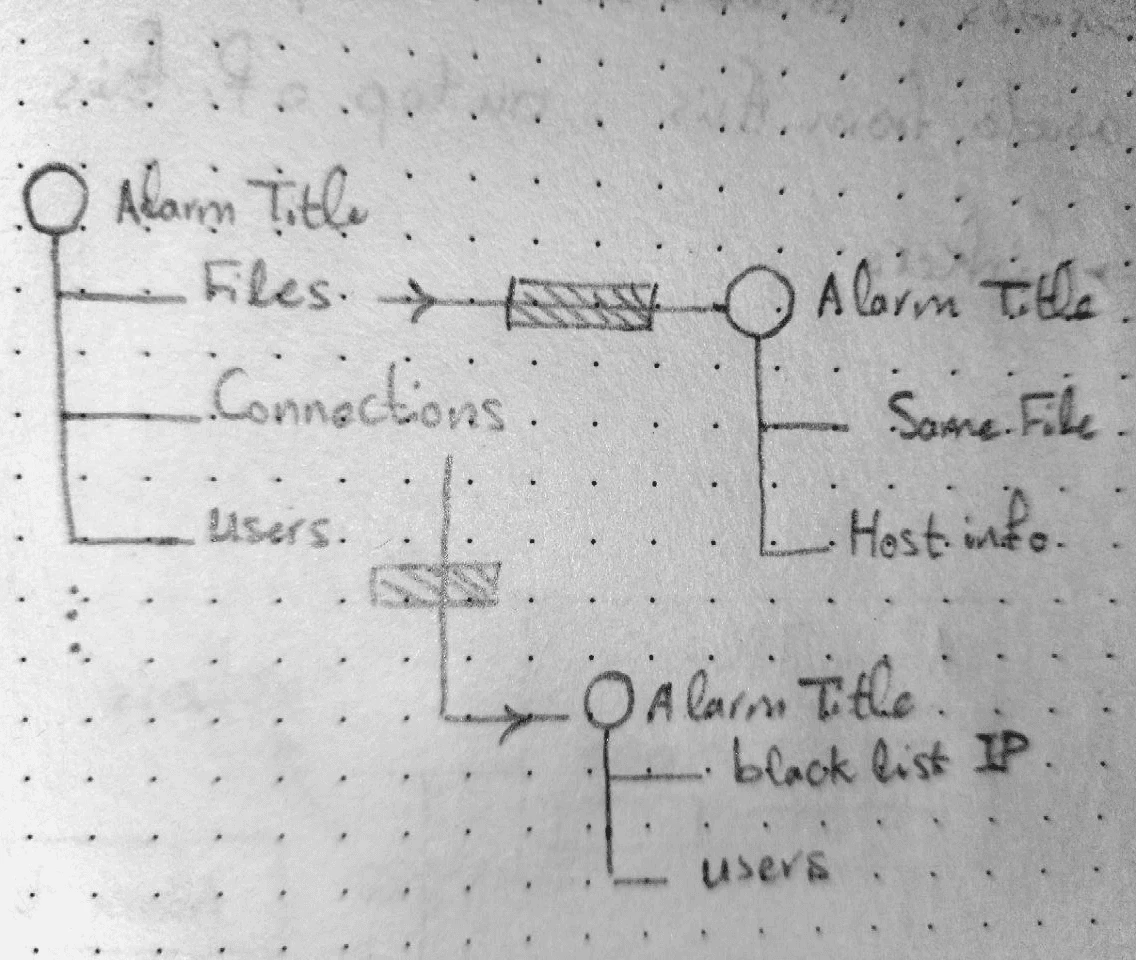
Interviews and benchmarking pointed to a presentation problem. We showed events like a log system, leaving analysts to reconstruct the network activity themselves. I explored ways to show relationships between alarms together.
One incident, several connected events
A file is downloaded, creates a connection to a banned IP, and changes a registry file. The alarms describe parts of the same story. The interface needed to make those relationships visible.
File
→
Connection
→
Registry
Exploration 1Selected directionExploration 3
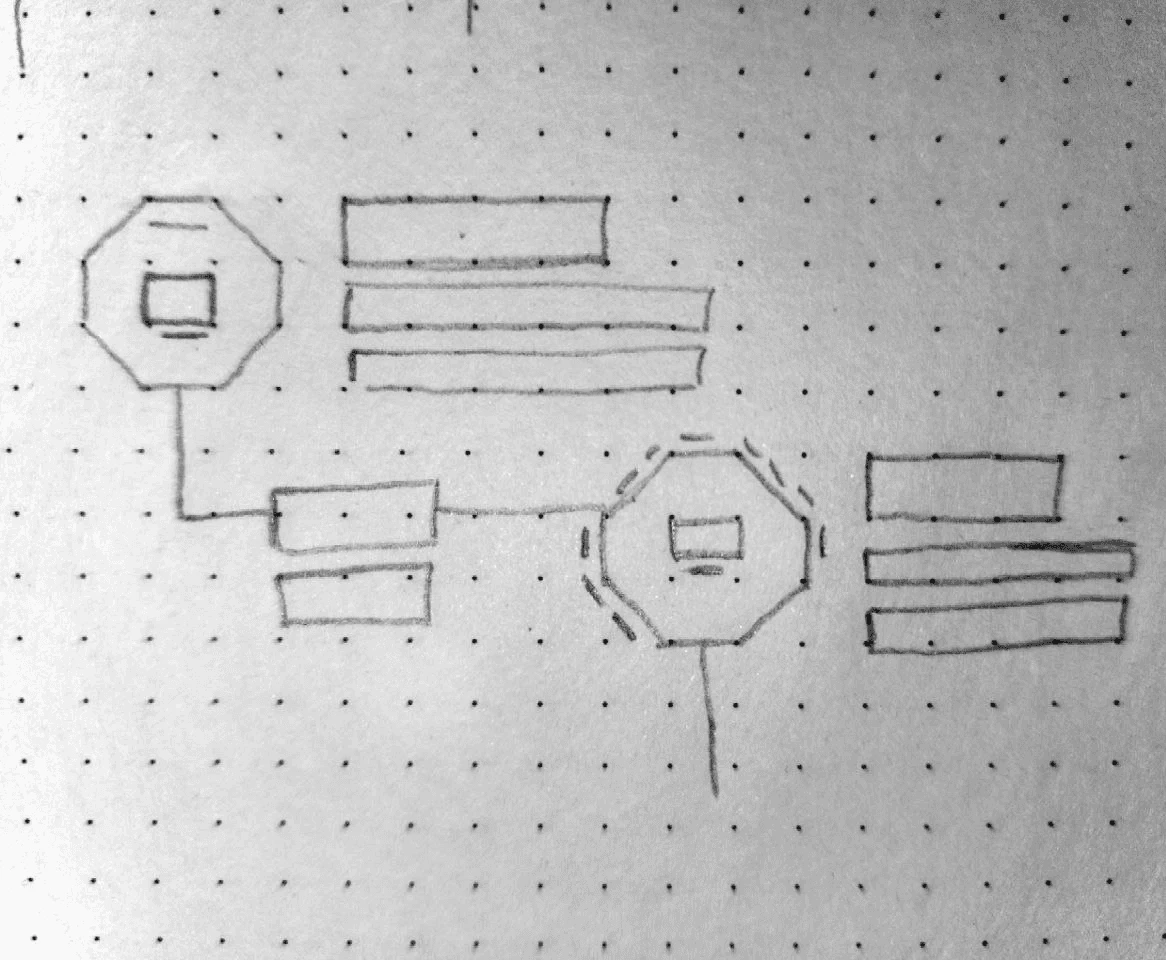
A graph organized around hosts
I chose the host-based graph because it was more visual, used less space than the alternatives, and was already familiar to security analysts. It also required less technical effort. Hosts were a useful organizing point because that was where analysts needed to take action.
The direction was to automatically identify connections between alarms and present the related alarms as an incident. Instead of piecing together hundreds of list entries, analysts could see the relationships in one view.
The incident view connects the evidence around the hosts involved.Alarms list and redesigned dashboard
BeforeAfter
Drag the divider or use the arrow keys to compare.
Problem 2I’ve found a threat. Responding still takes too many steps.
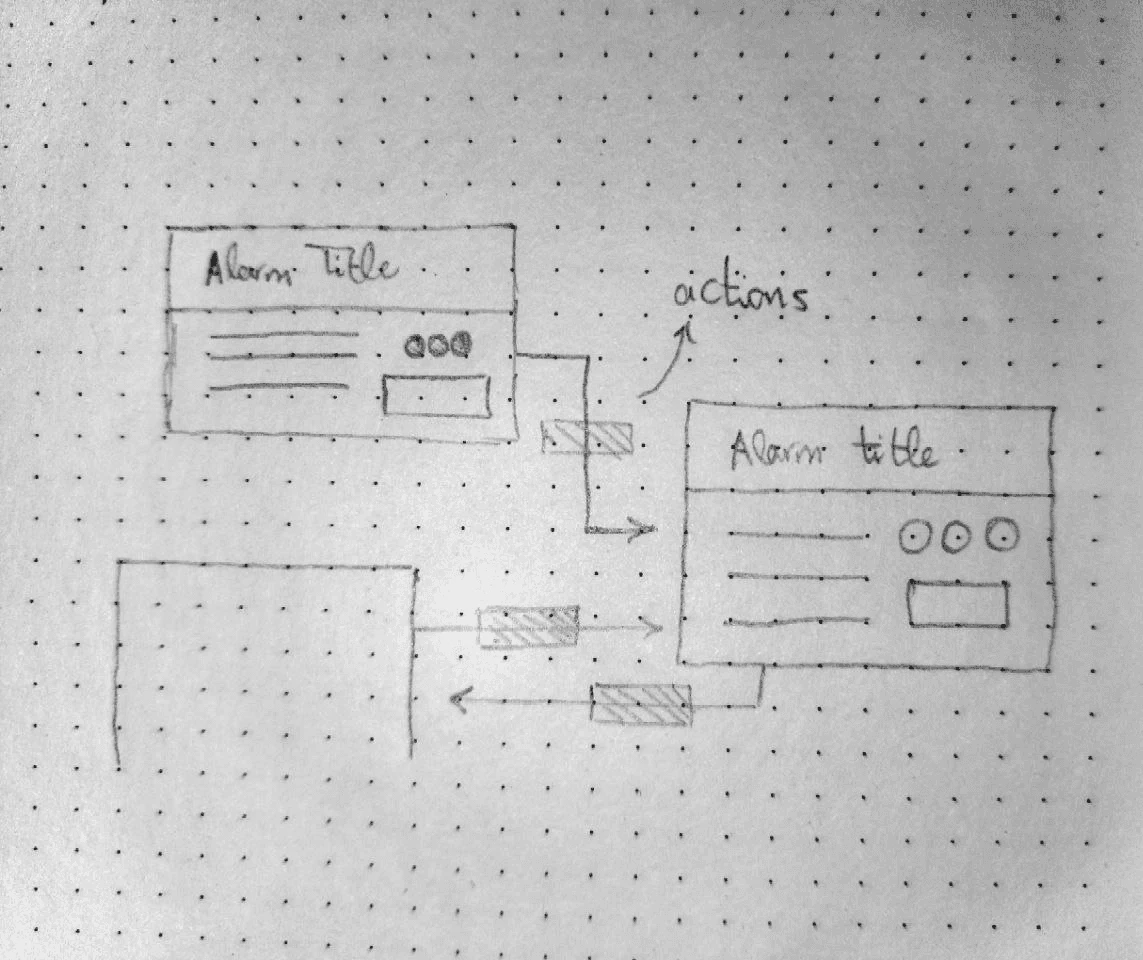
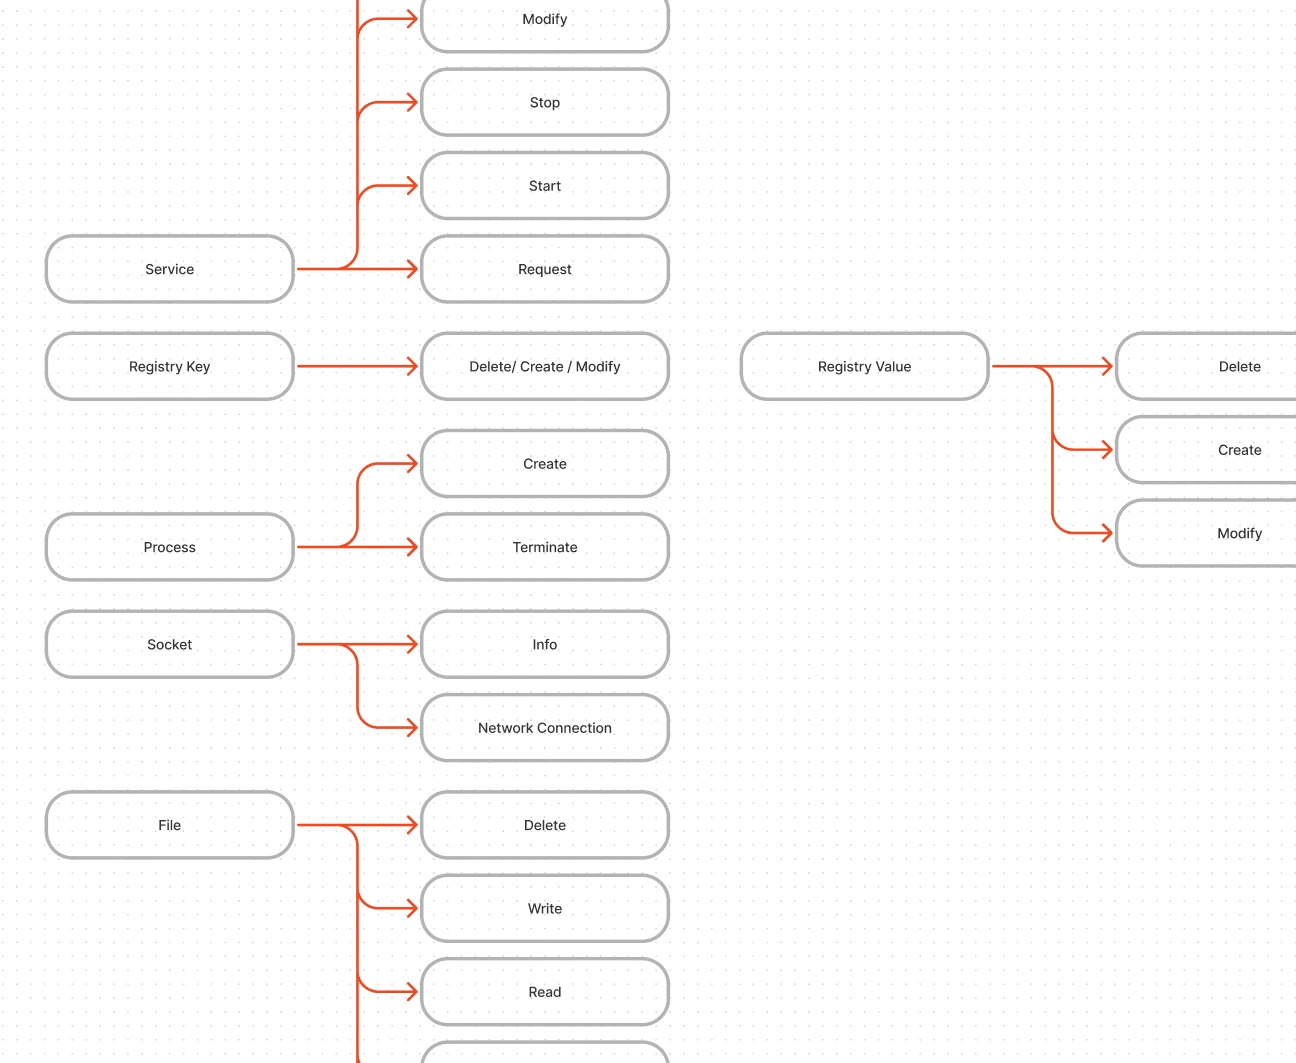
The graph created an opportunity to put actions directly on a host. But an action alone was not enough: analysts needed context to decide what to do. I mapped the actions each alarm element required and the questions that came before them.
Mapping the actions and information needed for each element.
The questions behind an action↗
Who downloaded the file?
Where was it first found?
Which user created the connection?
Which processes did the file run?
Which hosts did it infect?
When was the file seen?
What was its size?
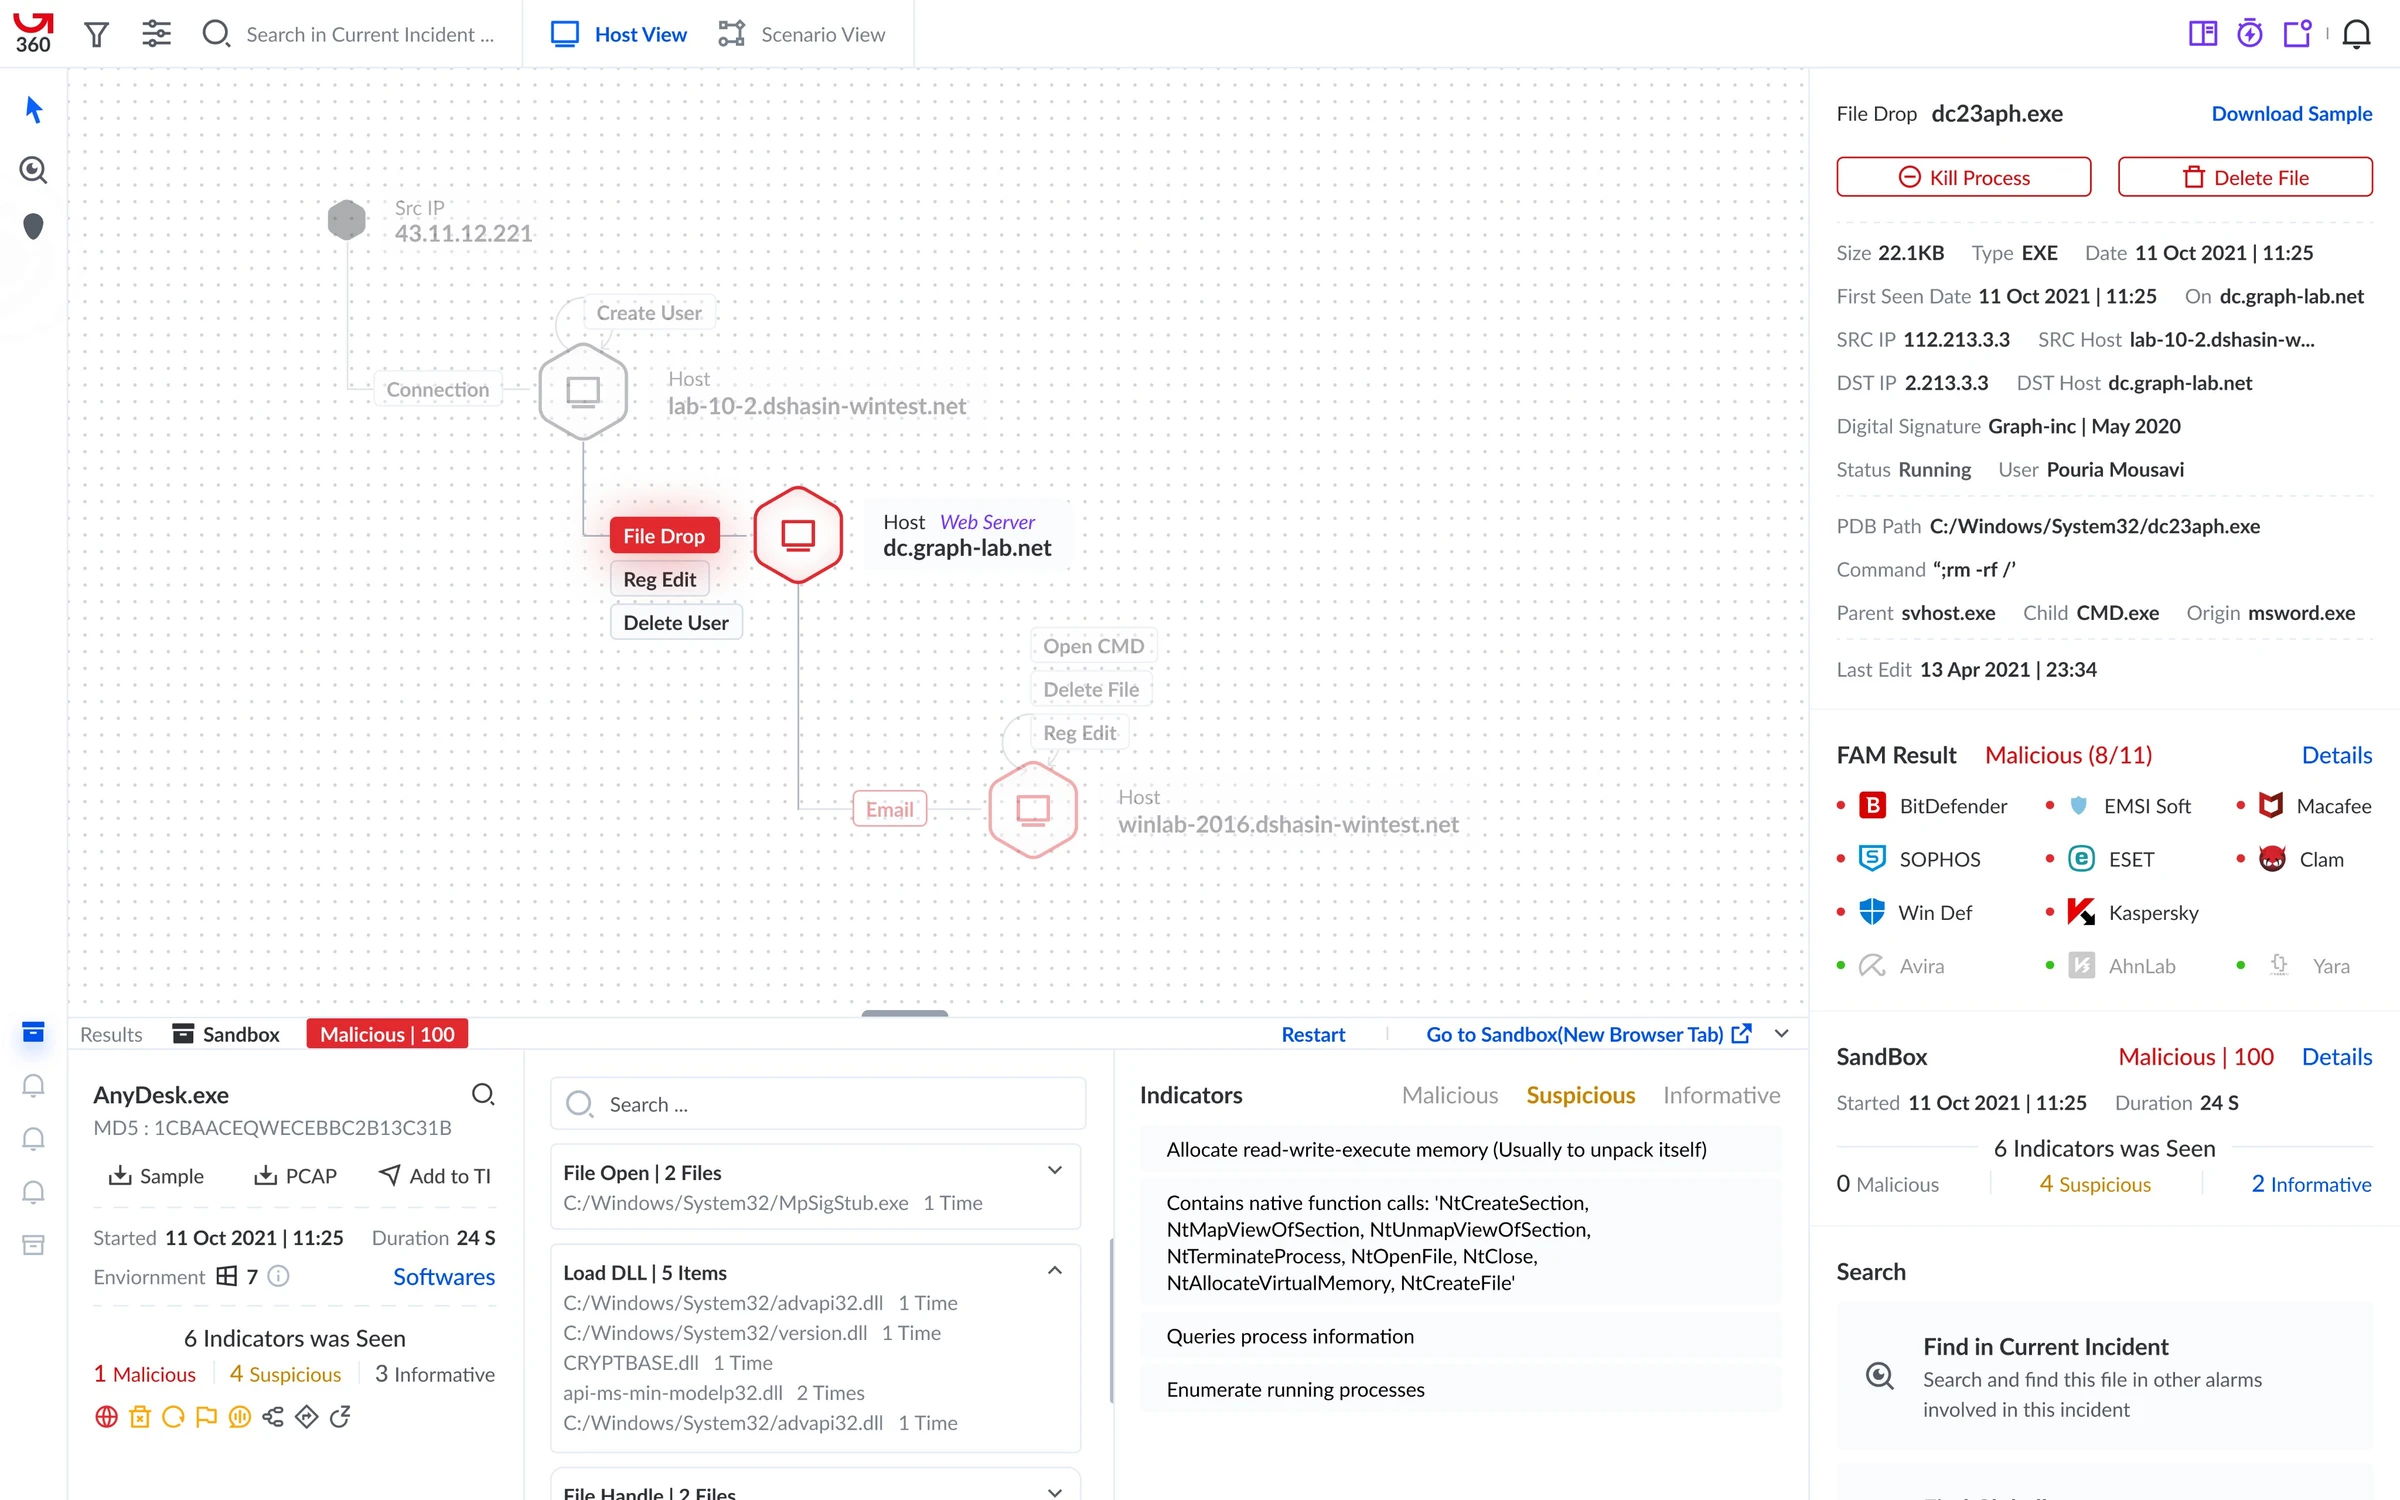
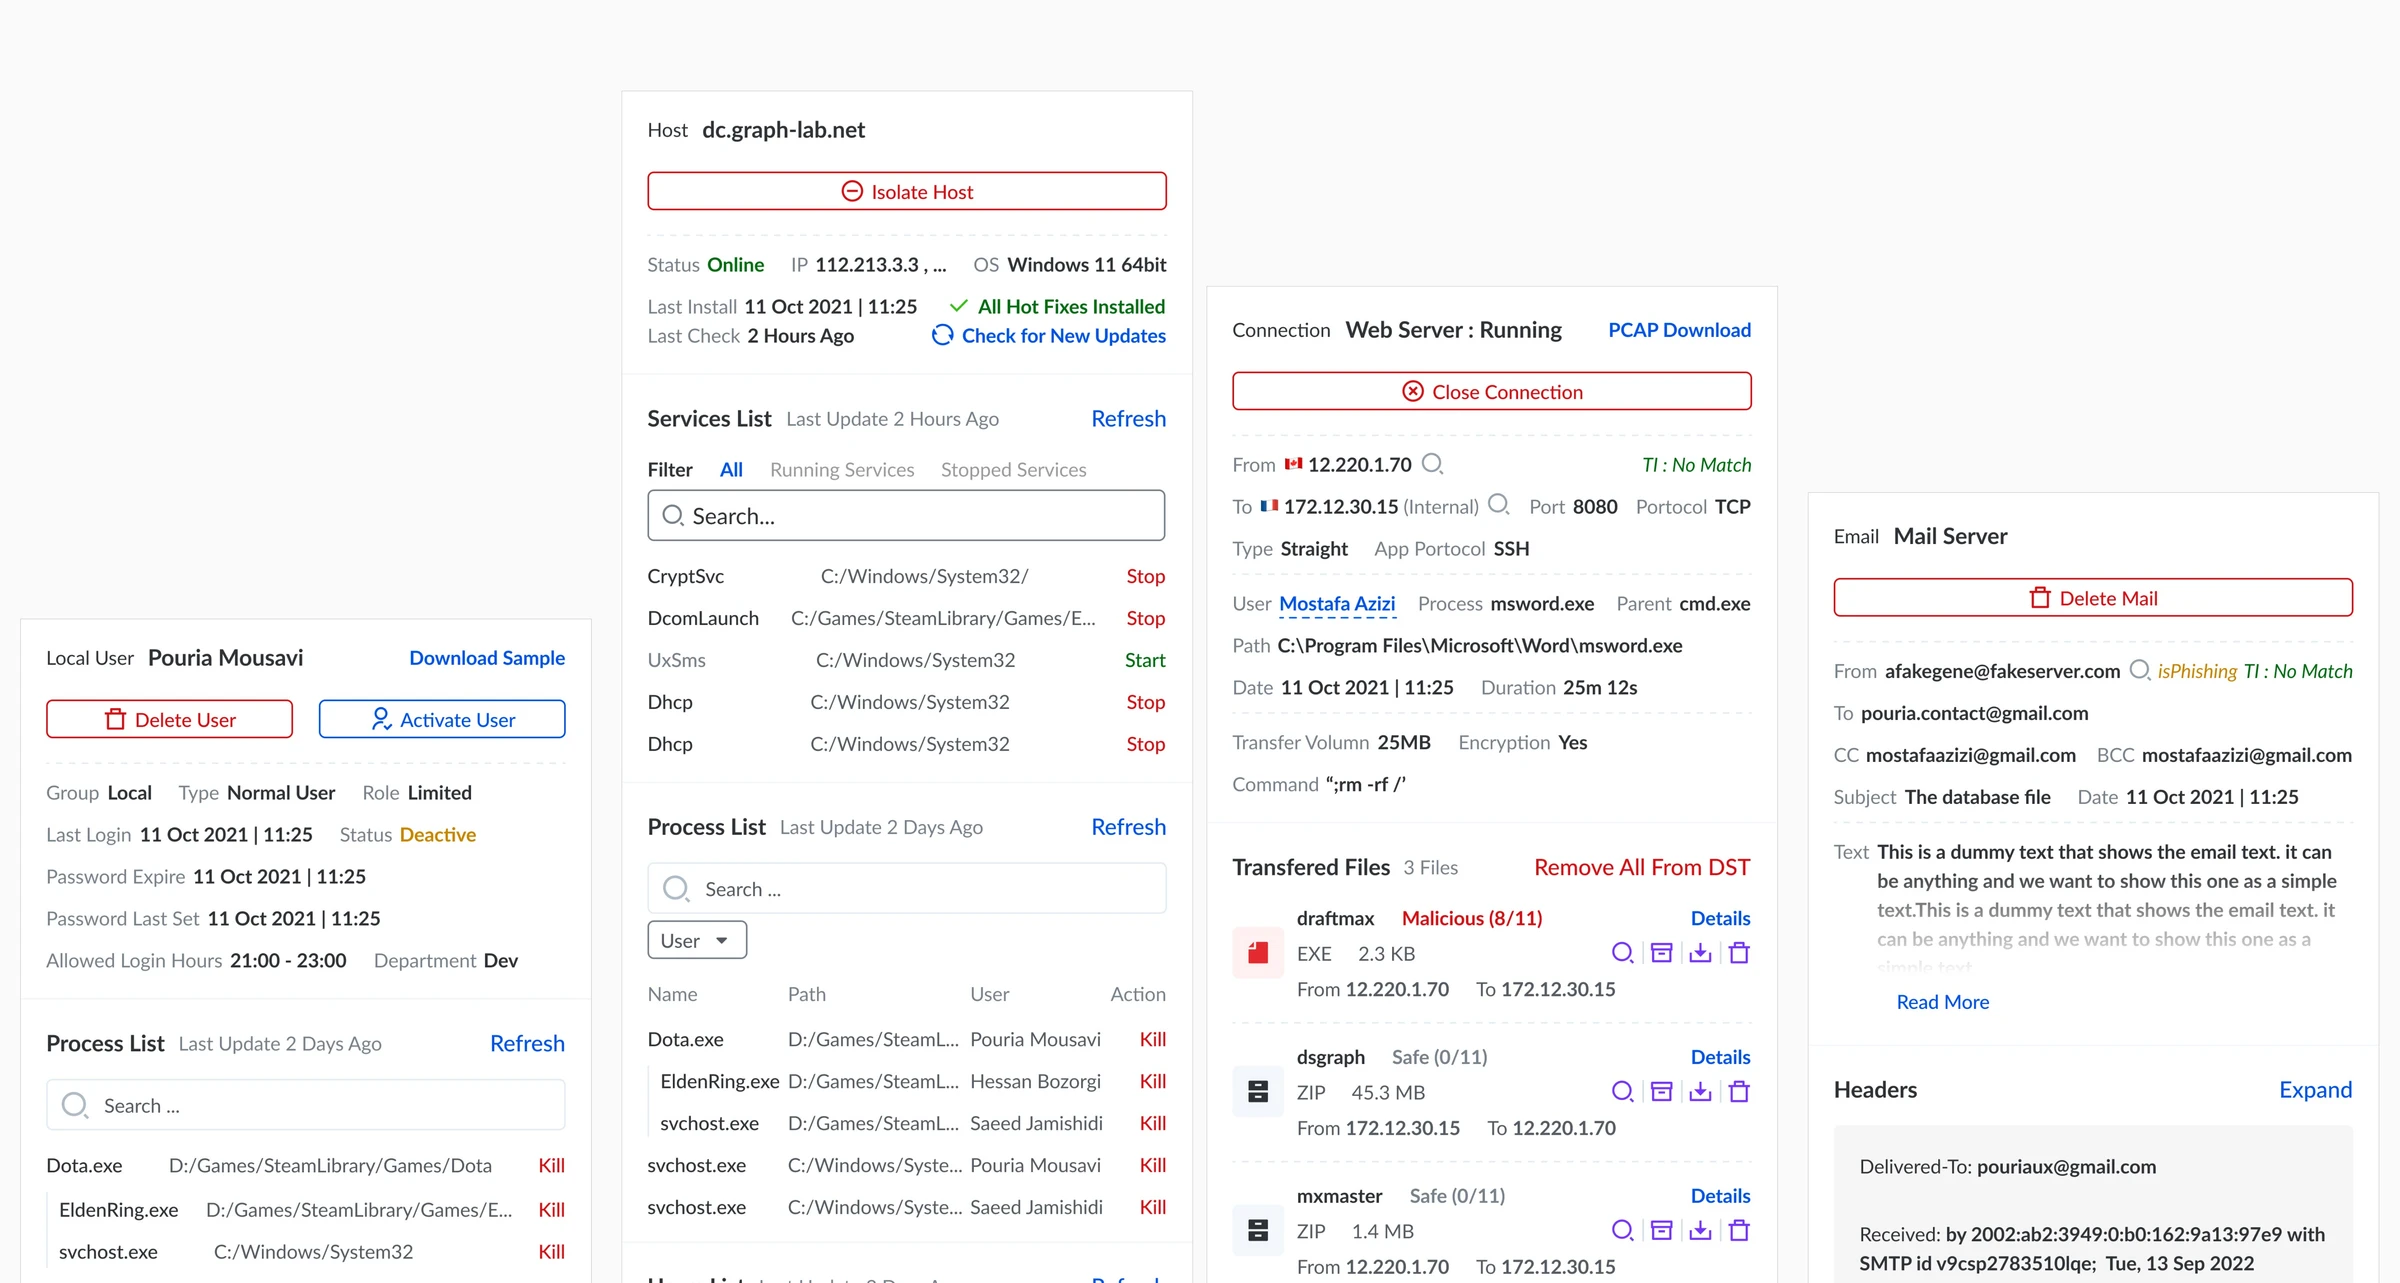
Profiles with information and actions together
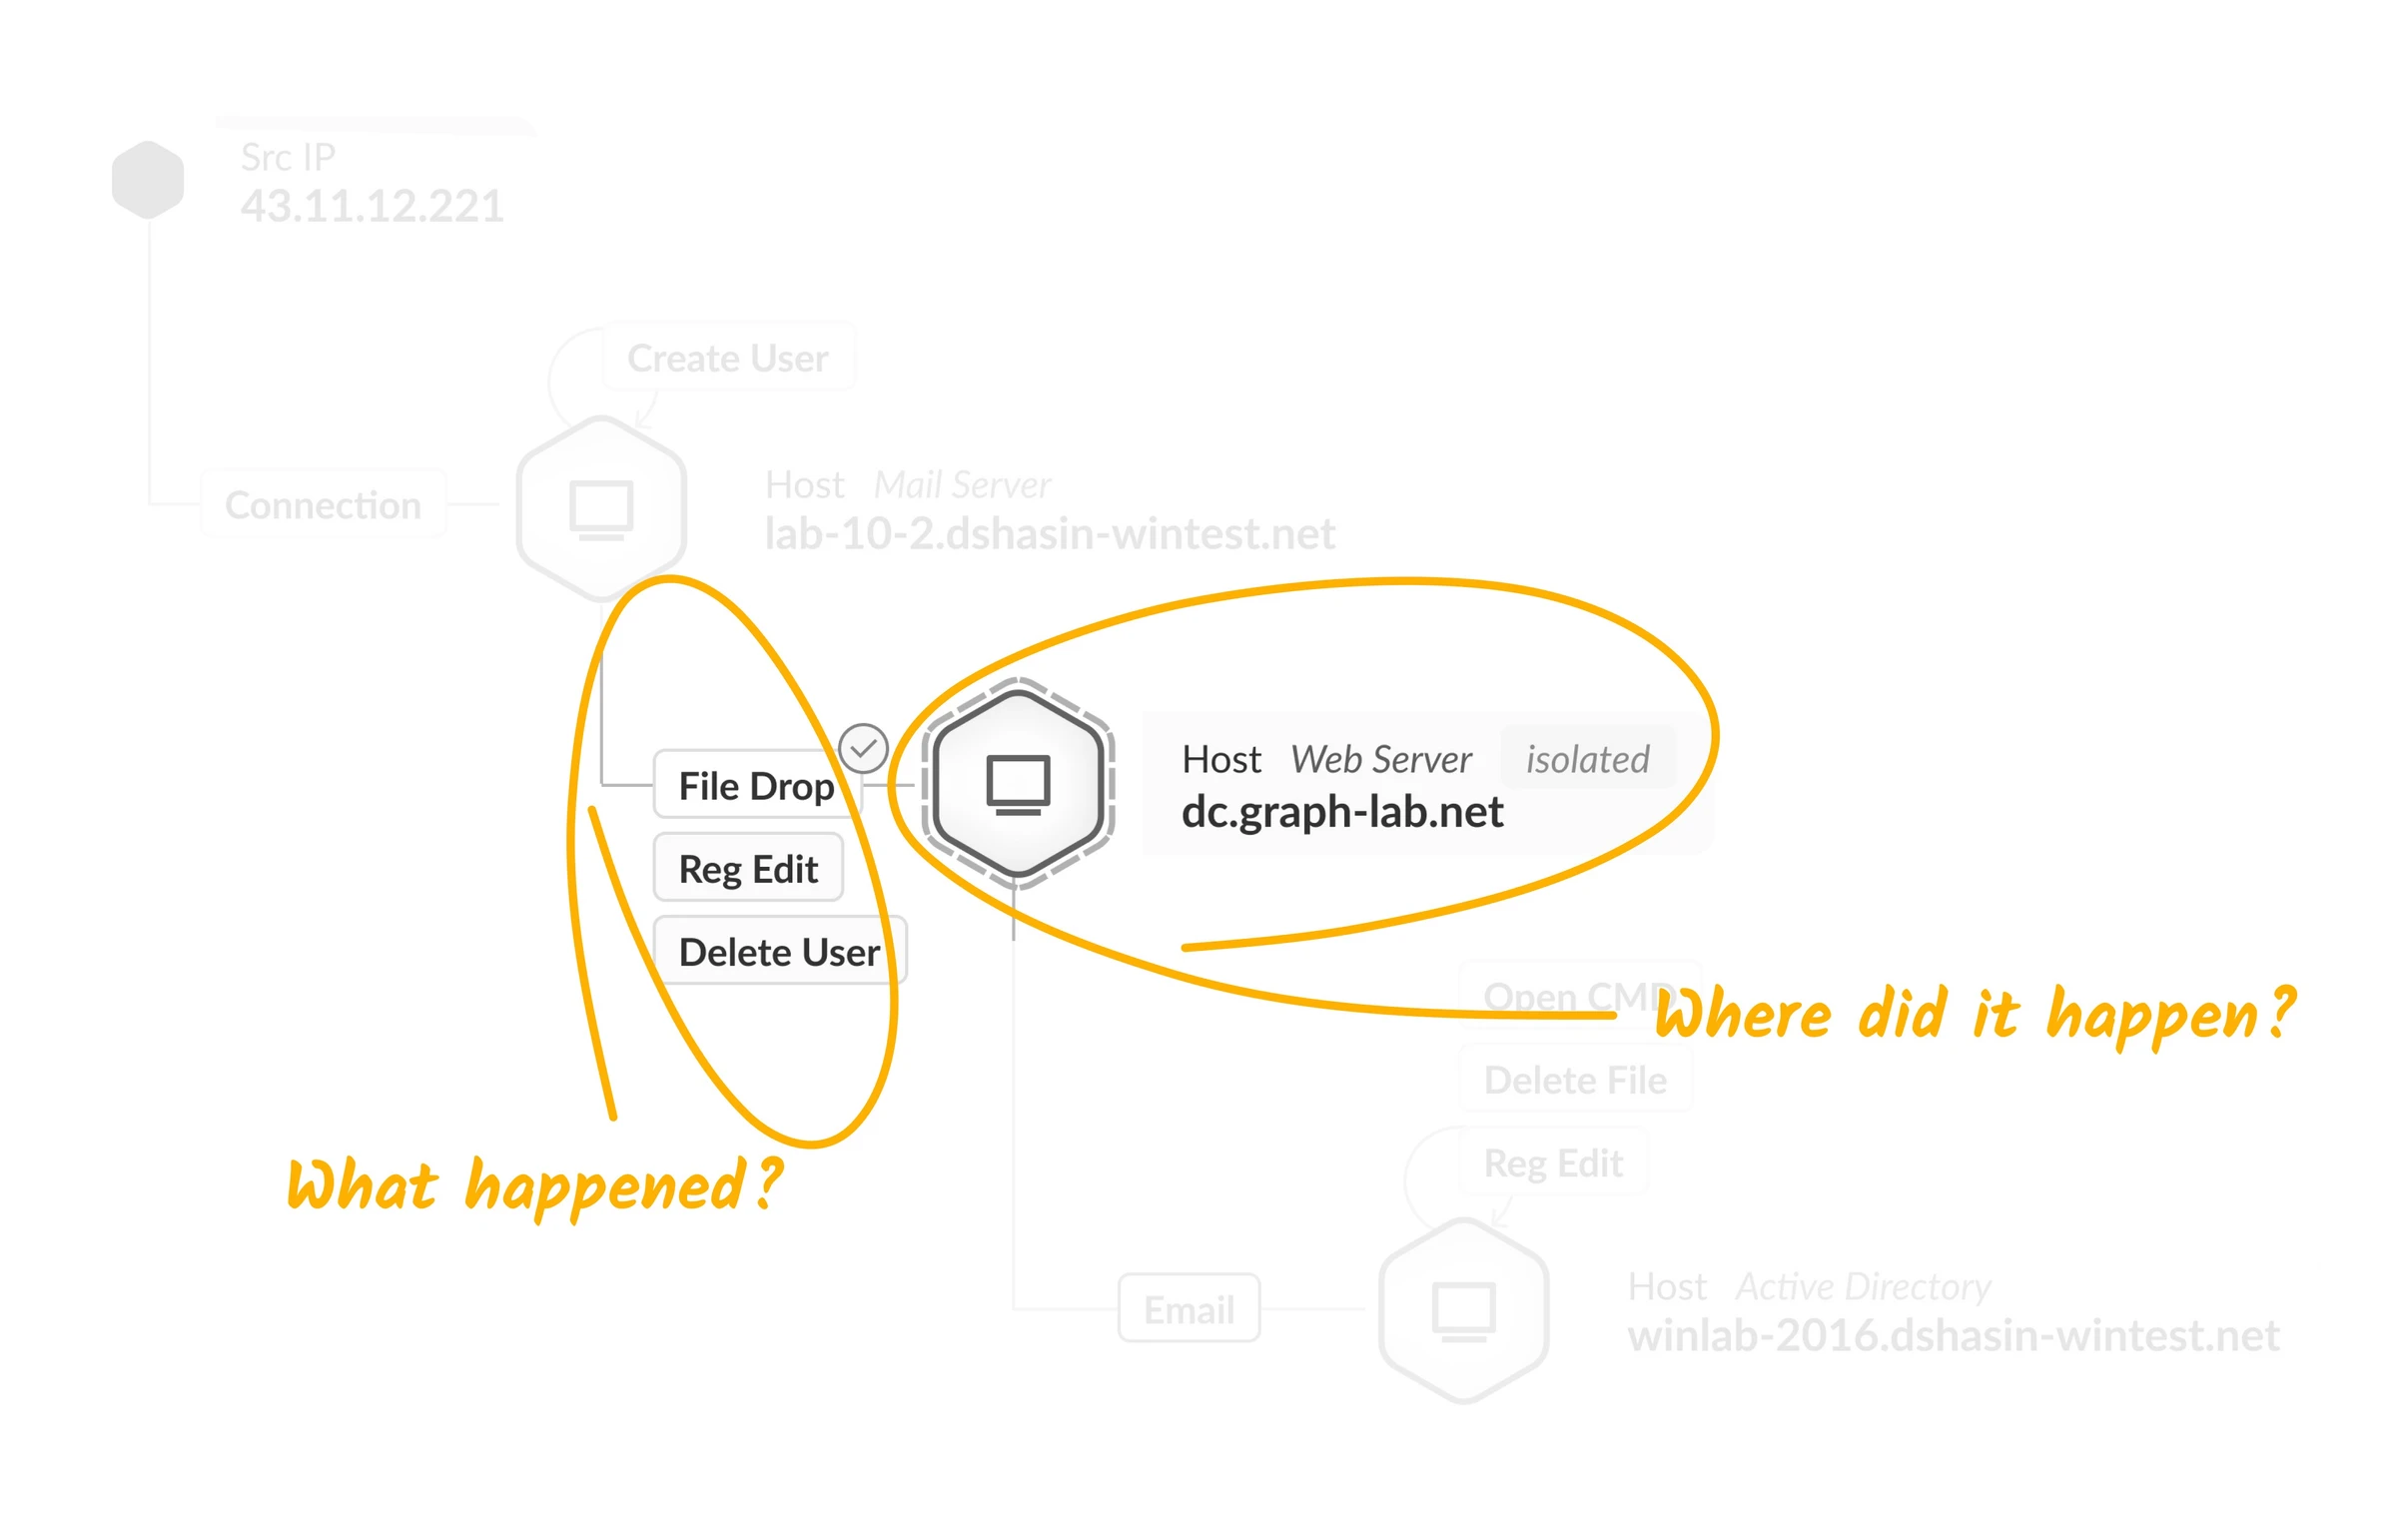
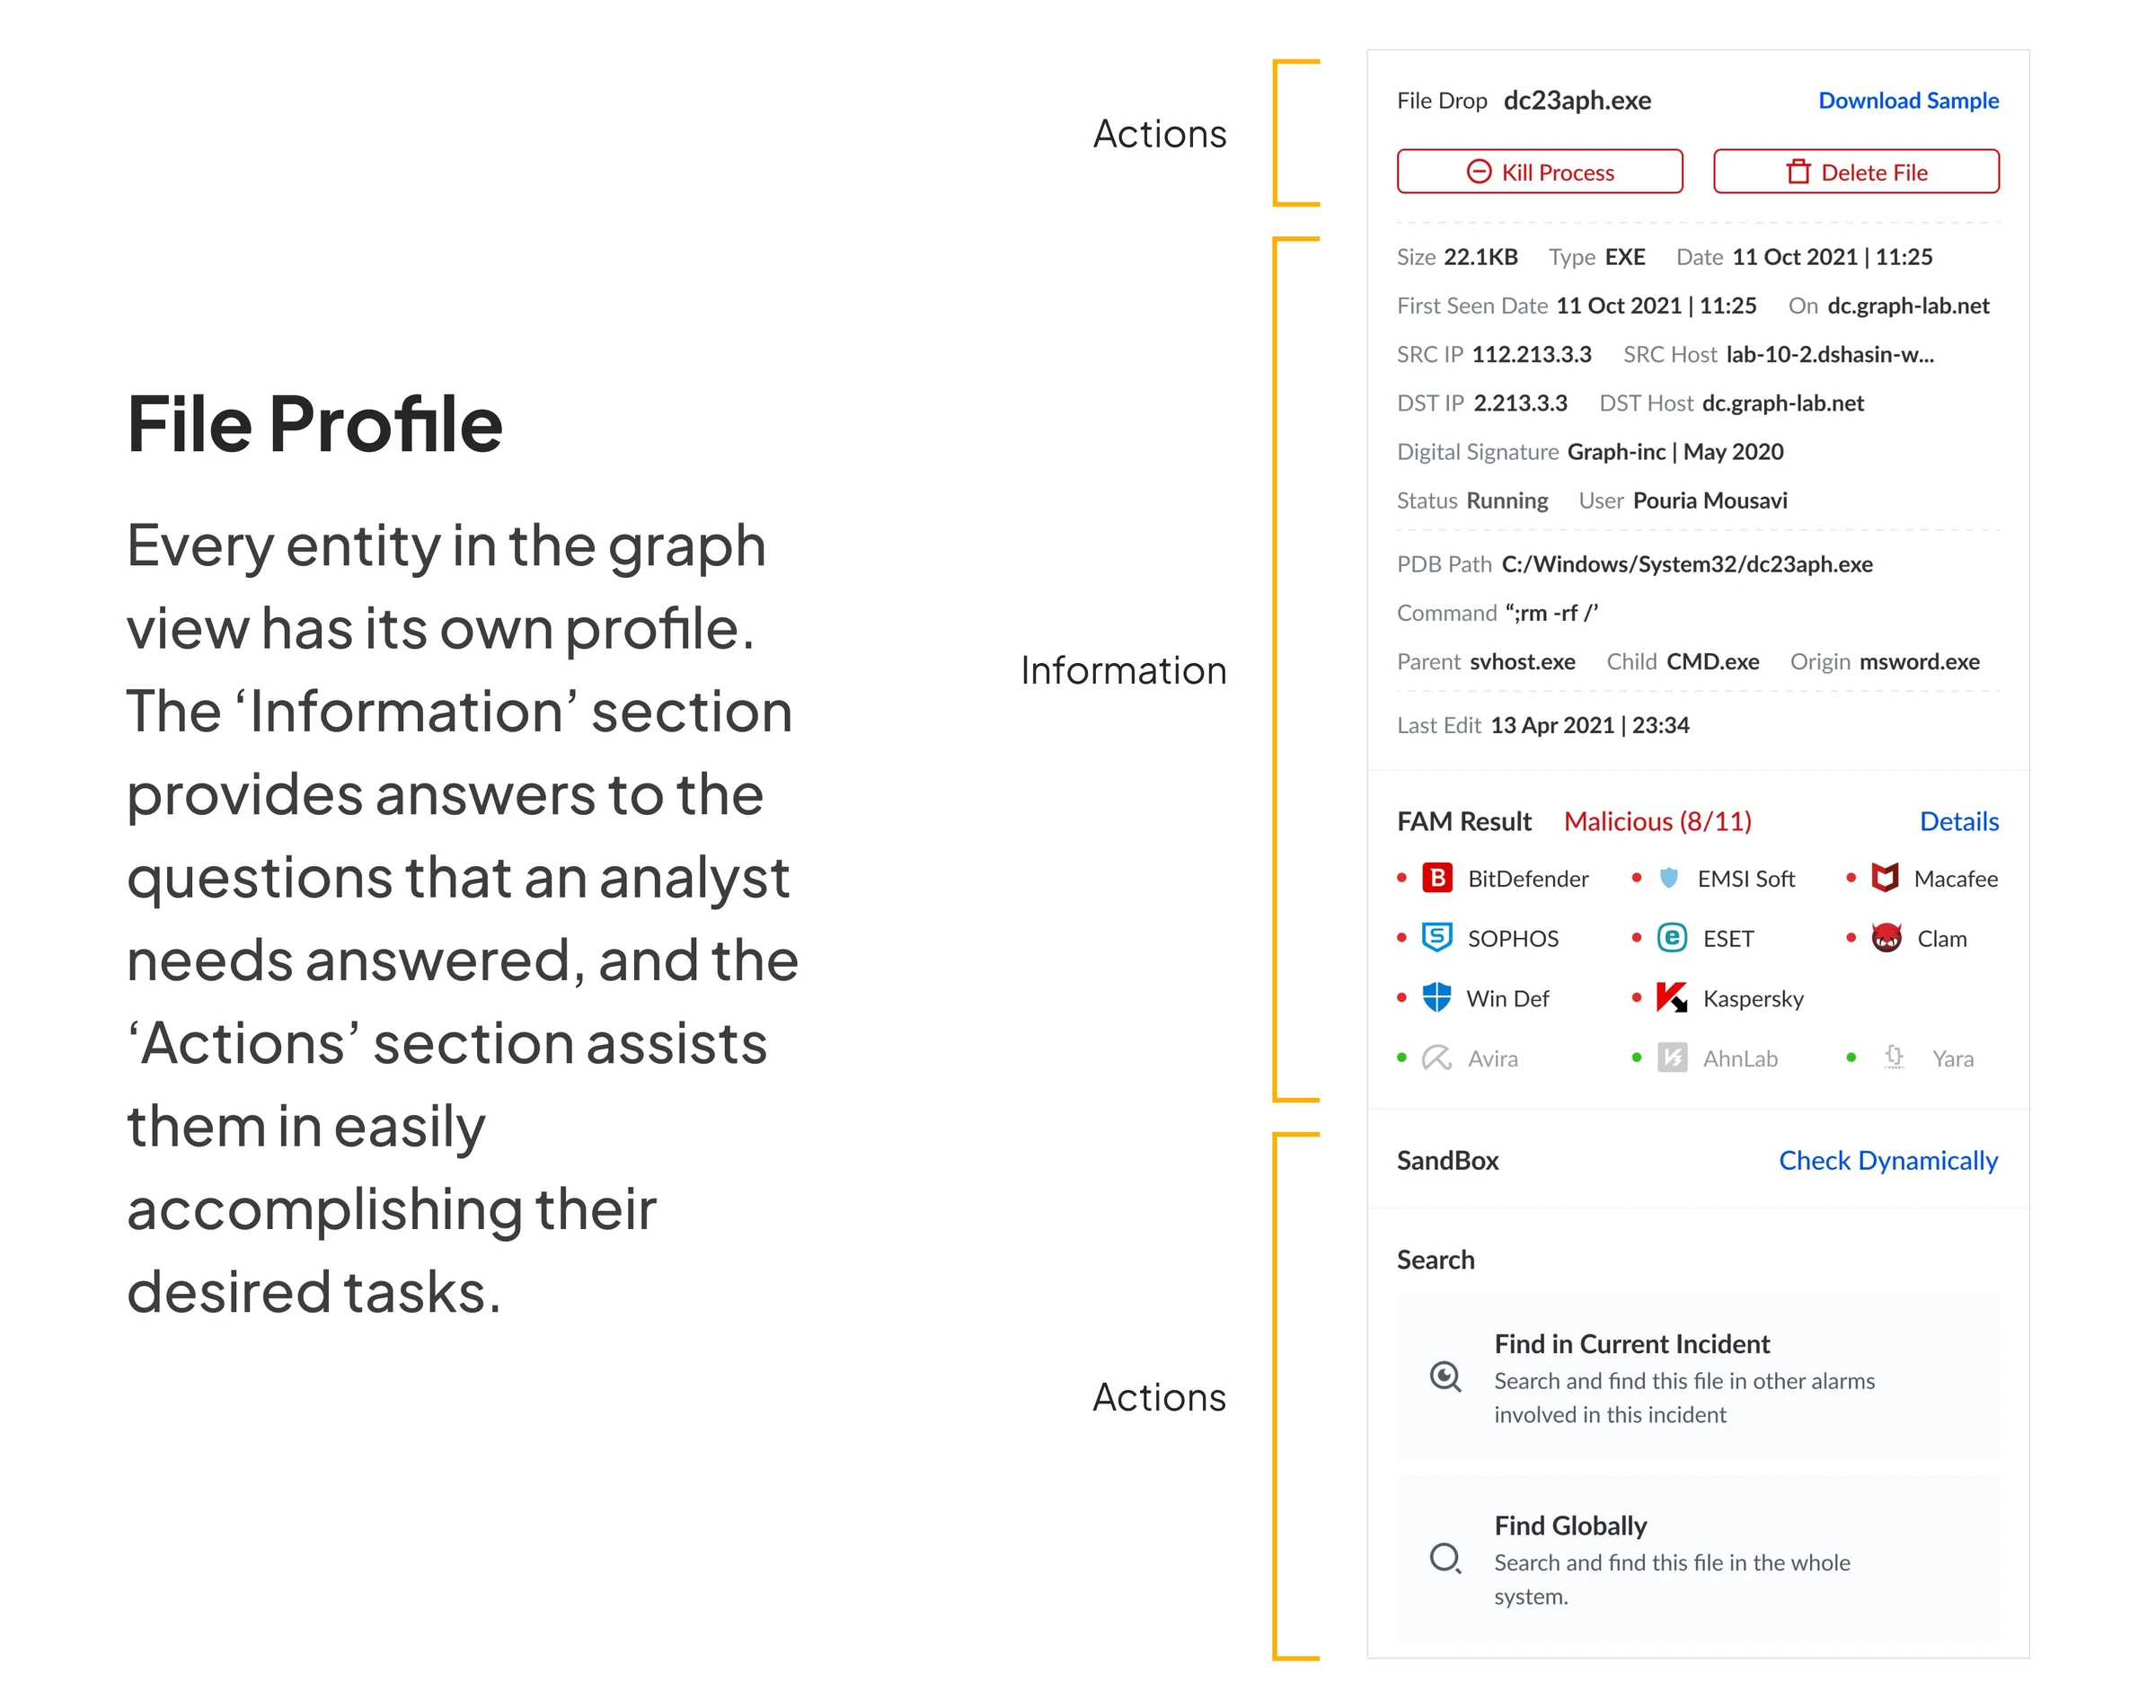
I designed profiles for elements in the graph. Each profile had two parts: information to support the decision, and actions to carry it out. Analysts could investigate the context and respond from the same place.
Two parts of the same decision: understand the element, then act.
The profile pattern across the elements of an incident.
04 · Three months later
Outcomes
We followed up with the marketing team and ran another usability test after three months.
Customer churn
25% → 2%
Average attack scenarios detected per day
+37%
↗
Average error rate
−17%
↘
My contribution
I planned the research, observed analysts, conducted interviews, and explored ways to connect the evidence. I designed the incident graph and contextual profiles, working with the development team on automatic extraction and the constraints of a complex technical product.
Challenges and lessons↗
Changing a technical team’s approach
I had to make the case for automatic data extraction. It required a shift in how the development team approached the problem.
A small team in a complex domain
There was more work than the early design team could cover. I also had a lot to learn about security before I could make useful decisions.
Adapt the process to the team
We adjusted the design process to fit our deadlines and capacity. When I did not have enough data to support a decision, collaboration within the squad helped us choose a direction.
05 · The next areas of work
What comes next
After the redesign and acquiring new customers, we worked on further ways to reduce the steps in an analyst’s response.
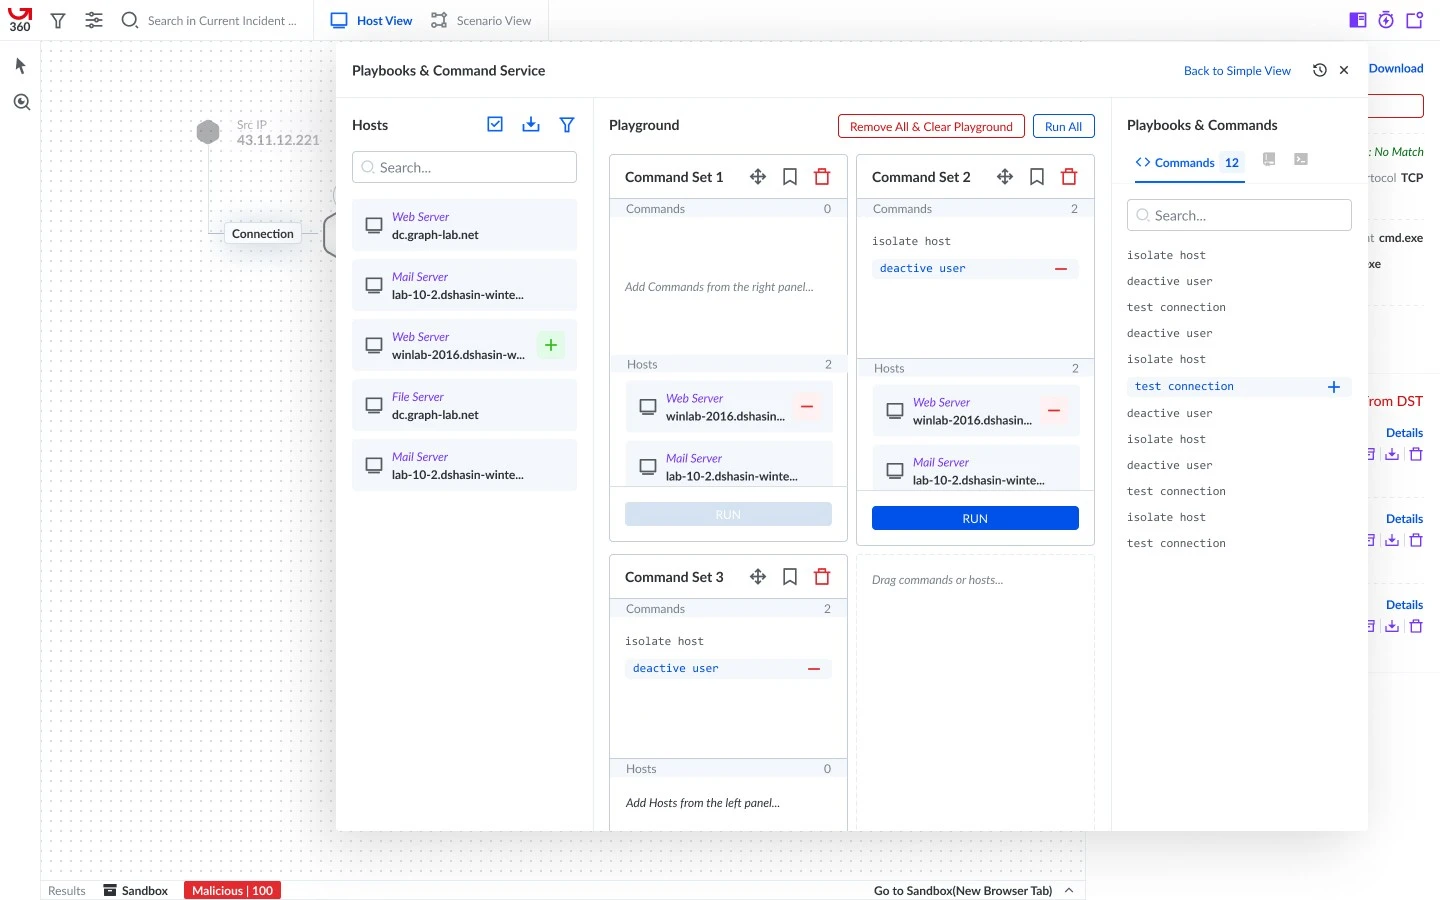
Playbooks
Run several commands across multiple hosts at the same time.
→→
The next direction: coordinating response commands across hosts.
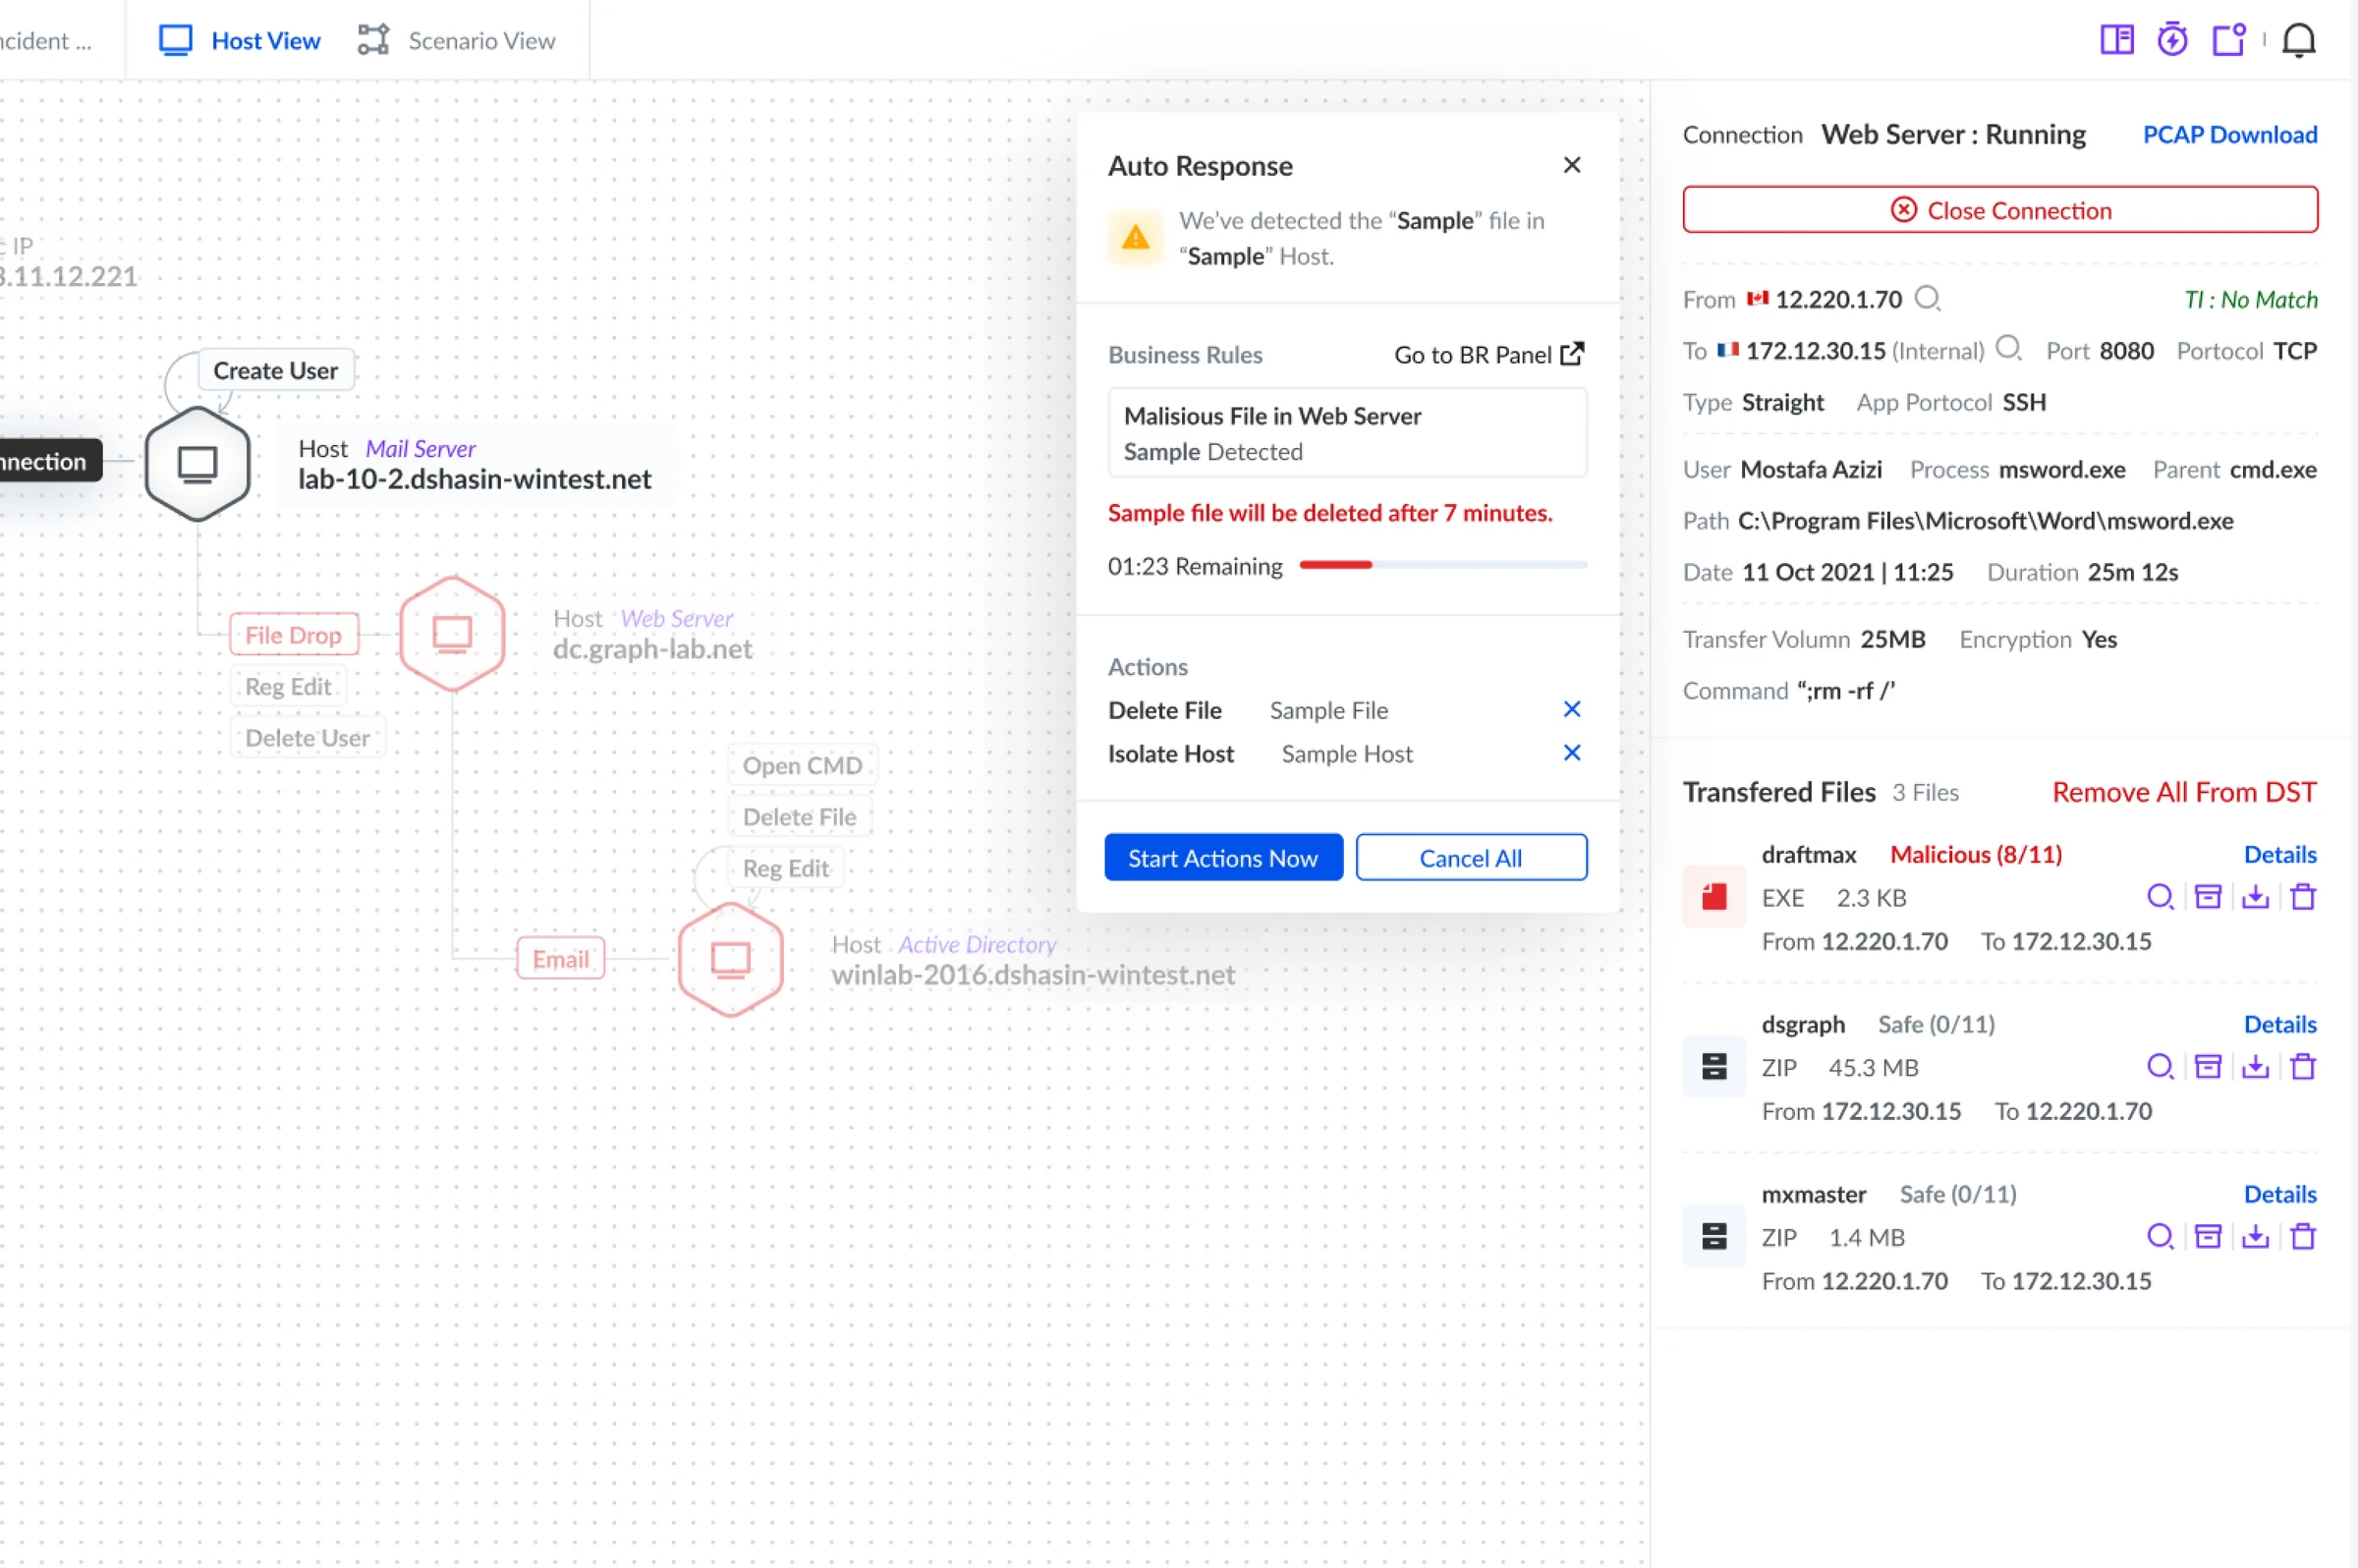
Auto response
Define actions for recognized threats so those commands can execute automatically.
→→
The next direction: predefined responses to known threats.